3.4. Monitoring Storage Cluster Remotely
You can monitor your storage cluster via Prometheus remotely. To do this, you need to open a TCP port for Prometheus API to be accessible from the outside.
To open a port, do the following:
On the INFRASTRUCTURE > Networks screen, click Edit and then Create traffic type.
In the Create traffic type window, specify a custom name in the Name field and
9090in the Port field.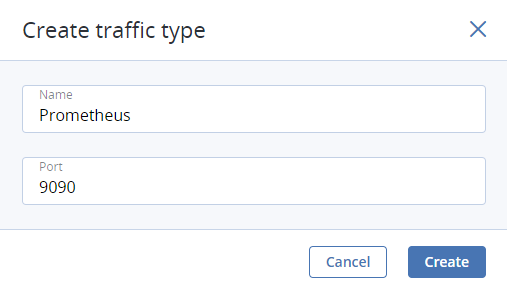
Click Create.
Add the newly created traffic type to your public network by ticking the corresponding checkbox.
Click Save to apply the changes.
You can now access the built-in Prometheus web-based user interface at http://<admin_panel_IP_address>:9090. For more information on using Prometheus, refer to its documentation.
If you have an external Grafana account and want to use it for monitoring Acronis Software-Defined Infrastructure, you can add Prometheus as a data source as follows:
- Log in into your Grafana user interface.
- Click the cogwheel icon in the left menu and select Data Sources.
- On the Data Sources tab, click Add data source.
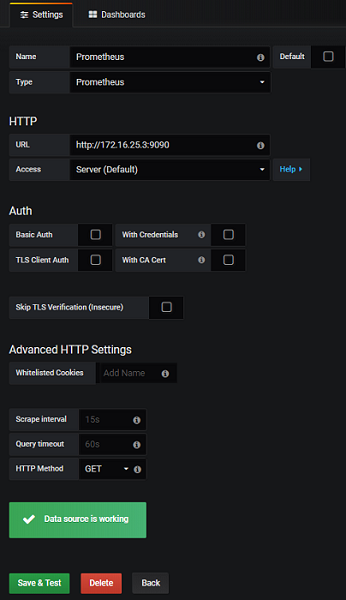
- On the Data Sources / New screen, specify the following parameters:
- Enter a custom data source name in the Name field.
- Set Type to
Prometheus. - Enter
http://<admin_panel_IP_address>:9090in the URL field.
- Click Save & Test.
If the specified parameters are correct, the Data source is working message will appear.
Using the newly added Prometheus data source, you can import the default Grafana dashboards from Acronis Software-Defined Infrastructure or create new ones.