4.9. Monitoring the Compute Cluster
After you create the compute cluster, you can monitor it on the COMPUTE > OVERVIEW screen.
The charts show the information on CPU, RAM, and storage usage; the number of virtual machines grouped by status and resource consumption; and compute-related alerts.
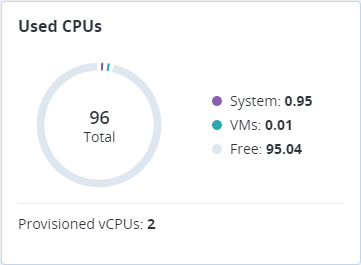
4.9.1. Used CPUs Chart
This chart displays CPU utilization of the compute cluster. The following statistics are available:
- System
- The number of logical cores used by system and storage services on all nodes in the compute cluster.
- VMs
- The number of logical cores used by virtual machines on all nodes in the compute cluster.
- Free
- The number of unused logical cores on all nodes in the compute cluster.
- Total
- The total number of logical cores on all nodes in the compute cluster.
- Provisioned vCPUs
- The number of vCPUs provisioned for all VMs in the compute cluster.
A similar chart is available for each individual node in the compute cluster.
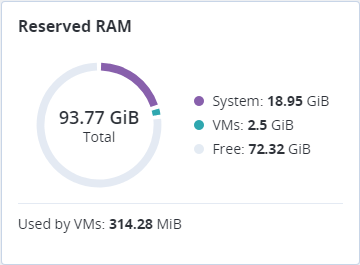
4.9.2. Reserved RAM Chart
This chart displays RAM utilization of the compute cluster. The following statistics are available:
- System
- The amount of RAM reserved for system and storage services on all nodes in the compute cluster.
- VMs
- The amount of RAM provisioned for all VMs in the compute cluster.
- Free
- The amount of free RAM on all nodes in the compute cluster.
- Total
- The total amount of RAM on all nodes in the compute cluster.
- Used by VMs
- The amount of RAM actually used by all VMs in the compute cluster.
A similar chart is available for each individual node in the compute cluster.
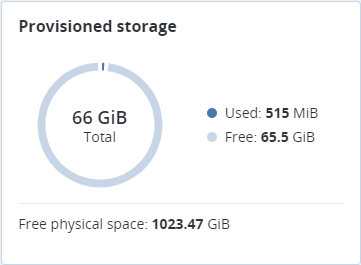
4.9.3. Provisioned Storage Chart
This chart shows usage of storage space by the compute cluster. The following statistics are available:
- Used
- The amount of storage space actually occupied by data in all volumes provisioned in the compute cluster.
- Free
- The amount of unused space in all volumes provisioned in the compute cluster.
- Total
- The total size of volumes provisioned in the compute cluster.
- Free physical space
- The amount of physical space available in the storage cluster.
4.9.4. VM Status Chart
The VMs status chart shows the total number of virtual machines in the compute cluster and groups them by status, which can be the following:
- Running
- The number of virtual machines that are up and running.
- In progress
- The number of virtual machines that are in a transitional state: building, restarting, migrating, etc.
- Stopped
- The number of virtual machines that are suspended or powered off.
- Error
- The number of virtual machines that have failed. Try troubleshooting such VMs via the console or rebuild them.
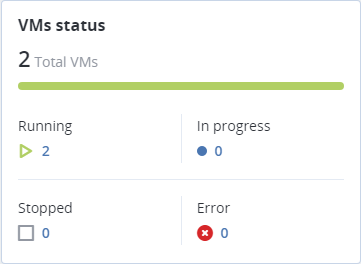
To see a full list of virtual machines filtered by the chosen status, click the number next to the status icon.
4.9.5. Top VMs Chart
The Top VMs chart lists virtual machines with the highest resource consumption sorted by CPU, RAM, or Storage in descending order. To switch between lists, click the desired resource.
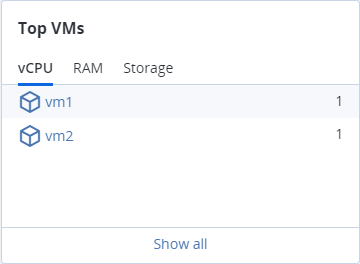
To see a full list of virtual machines in the compute cluster, click Show all.
4.9.6. Alerts Chart
The Alerts chart lists all the alerts related to the compute cluster sorted by severity. Alerts include the following:
- Critical
- The compute cluster has encountered a critical problem. For example, one or more of its components have been unavailable for more than 10 seconds or some resource has exceeded its soft limit.
- Warning
- The compute cluster is experiencing issues that may affect its performance. For example, one or more of its components operate slowly or some resource is approaching its soft limit.
- Other
- Some other issue has happened with the compute cluster. For example, its license is about to expire or has expired.
To see a full list of compute-related alerts, click Show all.
4.9.7. Per-VM Charts
You can monitor performance individual VMs on the COMPUTE > VIRTUAL MACHINES > VM > Monitoring tab.
The default time interval for the charts is 12 hours. To zoom into a particular time interval, select the internal with the mouse; to reset zoom, double click any chart.
The following performance charts are available:
- CPU / RAM
- CPU and RAM usage by the VM.
- Network
- Incoming and outgoing network traffic.
- Storage read/write
- Amount of data read and written by the VM.
- Read/write latency
- Read and write latency. Hovering the mouse cursor over a point on the chart, you can also see the average and maximum latency for that moment as well as the 95 and 99 percentiles.