3.2. Monitoring Nodes
Nodes added to the infrastructure are listed on the NODES screen, grouped by status. If the storage cluster has not been created yet, you will only see nodes in the UNASSIGNED list. If the storage cluster exists, its nodes will be listed on the screen.
The default time interval for the charts is 12 hours. To zoom into a particular time interval, select the internal with the mouse; to reset zoom, double click any chart.
3.2.1. Node Statuses
A node can have one of the following statuses:
- HEALTHY
- All the storage services on the node are running.
- OFFLINE
- The node cannot be reached from the admin panel, although it may still be up and its services may be running.
- FAILED
- One or more storage services on the node have failed.
- UNASSIGNED
- The node is not assigned to a cluster.
3.2.2. Monitoring Node Performance
To monitor the performance of a cluster node, open the NODES screen and click the node. On the node overview screen, you will see performance statistics described below.
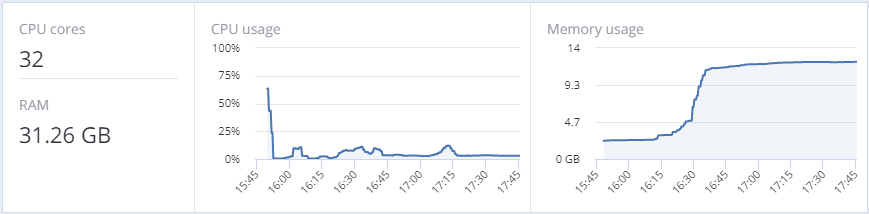
The overall statistics include:
- the number of CPUs and the amount of RAM,
- CPU usage, in percent over time,
- RAM usage, in gigabytes over time.
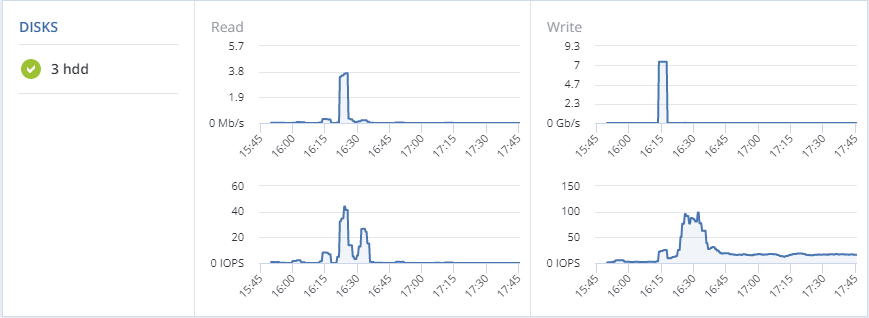
The DISKS section shows:
- the number of HDD and SSD drives and their statuses,
- node I/O activity over time on the read and write charts.
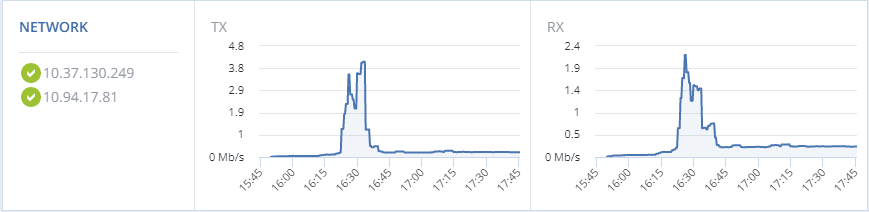
The NETWORK section shows:
- the list of network interfaces and their statuses,
- the amount of transmitted (TX) and received (RX) traffic over time.
The following sections provide more information on disk and network usage.
3.2.3. Monitoring Node Disks
To monitor the usage and status of node disks, click the DISKS link on the node overview screen. You will see a list of all disks on the node and their status icons.
A disk status icon shows the combined status of S.M.A.R.T. and the service corresponding to the disk role. It can be one of the following:
- OK
- The disk and service are healthy.
- Failed
- The service has failed or S.M.A.R.T. reported an error.
- Releasing
- The service is being released. When the process finishes, the disk status will change to OK.
To monitor performance of a particular disk, select it and click Performance. The Drive performance panel will display the I/O activity of the disk.
To view information about the disk, including its S.M.A.R.T. status, click Details.
To have the disk blink its activity LED, select the disk, and click Blink. To have the disk stop blinking, click Unblink.
3.2.3.1. Monitoring the S.M.A.R.T. Status of Node Disks
The S.M.A.R.T. status of all disks is monitored by a tool installed along with Acronis Software-Defined Infrastructure. Run every 10 minutes, the tool polls all disks attached to nodes, including journaling SSDs and system disks, and reports the results to the management node.
For the tool to work, make sure the S.M.A.R.T. functionality is enabled in node’s BIOS.
If a S.M.A.R.T. warning message is shown in the node status, one of that node’s disks is in pre-failure condition and should be replaced. If you continue using the disk, keep in mind that it may fail or cause performance issues.
Pre-failure condition means that at least one of these S.M.A.R.T. counters is not zero:
- Reallocated Sector Count
- Reallocated Event Count
- Current Pending Sector Count
- Offline Uncorrectable
3.2.4. Monitoring Node Network
To monitor the node’s network usage, click NETWORK on the node overview screen.
To display the performance charts of a specific network interface, select it in the list and click Performance. When monitoring network performance, keep in mind that if the Receive and transmit errors chart is not empty, the network is experiencing issues and requires attention.
To display the details of a network interface, click Details. The Network details panel shows the interface state, bandwidth, MTU, MAC address, and all IP addresses.