5.2. Monitoring the compute cluster
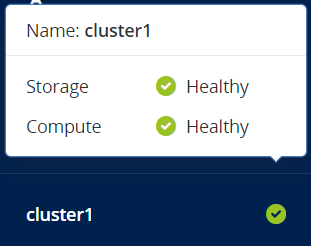
After you create the compute cluster, you can monitor its status and statistics. The status is displayed by clicking the cluster name at the bottom of the left menu. It can be one of the following:
- Healthy
- All compute cluster components and nodes operate normally.
- Configuring
- The compute cluster configuration (the default CPU model for VMs or the number of compute nodes) is changing.
- Warning
- The compute cluster operates normally, but some issues have been detected.
- Critical
- The compute cluster has encountered a critical problem and is not operational.
The compute cluster statistics are available on the Compute > Overview screen. The charts show the information on CPU, RAM, and storage usage; the number of virtual machines grouped by status and resource consumption; and compute-related alerts.
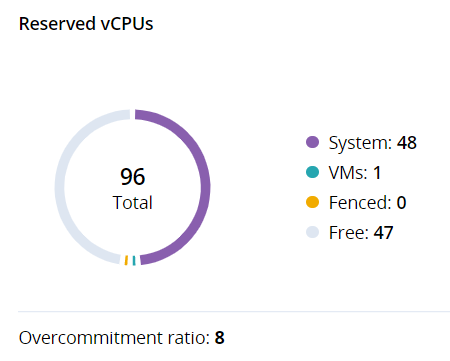
5.2.1. Reserved vCPUs chart
This chart displays vCPU reservations in the compute cluster. A vCPU reservation is a guarantee on vCPUs for a service or virtual machine. The following statistics are available:
- Total
- The total number of virtual CPUs in the compute cluster. It is a product of the total number of physical CPUs on all compute nodes and the overcommitment ratio.
- System
- The number of virtual CPUs reserved for the system and storage services on all nodes in the compute cluster. To learn more about CPU reservations for different services, refer to Hardware requirements.
- VMs
- The number of virtual CPUs provisioned for all virtual machines in the compute cluster.
- Free
- The number of free virtual CPUs on all nodes in the compute cluster.
- Fenced
- The number of virtual CPUs on all fenced nodes in the compute cluster.
- Overcommitment ratio
The ratio of the number of virtual CPUs to physical.
The parameter is set in
/etc/kolla/nova-compute/nova.conf. You can change it using the commandvinfra service compute set --nova-compute-cpu-allocation-ratio <value>(refer to Changing parameters in OpenStack configuration files).
A similar chart is available for each individual node in the compute cluster.
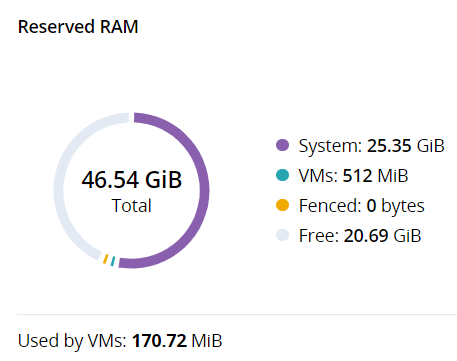
5.2.2. Reserved RAM chart
This chart displays RAM reservations in the compute cluster. A RAM reservation is a guarantee on RAM for a service or virtual machine. The following statistics are available:
- Total
- The total amount of RAM on all nodes in the compute cluster.
- System
- The amount of RAM reserved for the system and storage services on all nodes in the compute cluster. To learn more about RAM reservations for different services, refer to Hardware requirements.
- VMs
- The amount of RAM provisioned for all virtual machines in the compute cluster.
- Free
- The amount of free RAM on all nodes in the compute cluster.
- Fenced
- The amount of RAM on all fenced nodes in the compute cluster.
- Used by VMs
- The amount of RAM actually used by all VMs in the compute cluster.
A similar chart is available for each individual node in the compute cluster.
5.2.3. Provisioned storage chart
This chart shows usage of storage space by the compute cluster. The following statistics are available:
- Total
- The total size of volumes provisioned in the compute cluster.
- Used
- The amount of storage space actually occupied by data in all volumes provisioned in the compute cluster.
- Free
- The amount of unused space in all volumes provisioned in the compute cluster.
- Free physical space
- The amount of physical space available in the storage cluster.

5.2.4. Virtual machines status chart
The VMs status chart shows the total number of virtual machines in the compute cluster and groups them by status, which can be the following:
- Running
- The number of virtual machines that are up and running.
- In progress
- The number of virtual machines that are in a transitional state: building, restarting, migrating, etc.
- Stopped
- The number of virtual machines that are suspended or powered off.
- Error
- The number of virtual machines that have failed. You can reset the state for such VMs to their last stable state.
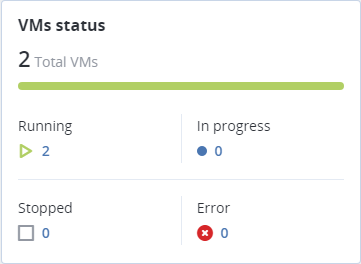
To see a full list of virtual machines filtered by the chosen status, click the number next to the status icon.
5.2.5. Top VMs chart
The Top VMs chart lists the virtual machines with the highest resource consumption sorted by CPU, RAM, or Storage, in descending order. To switch between lists, click the desired resource.
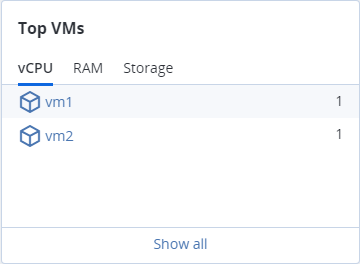
To see a full list of virtual machines in the compute cluster, click Show all.
5.2.6. Alerts chart
The Alerts chart lists all of the alerts related to the compute cluster, sorted by severity. Alerts include the following:
- Critical
- The compute cluster has encountered a critical problem. For example, one or more of its components have been unavailable for more than 10 seconds or some resource has exceeded its soft limit.
- Warning
- The compute cluster is experiencing issues that may affect its performance. For example, one or more of its components operate slowly or some resource is approaching its soft limit.
- Other
- Some other issue has happened with the compute cluster. For example, its license is about to expire or has expired.
To see a full list of compute-related alerts, click Show all.