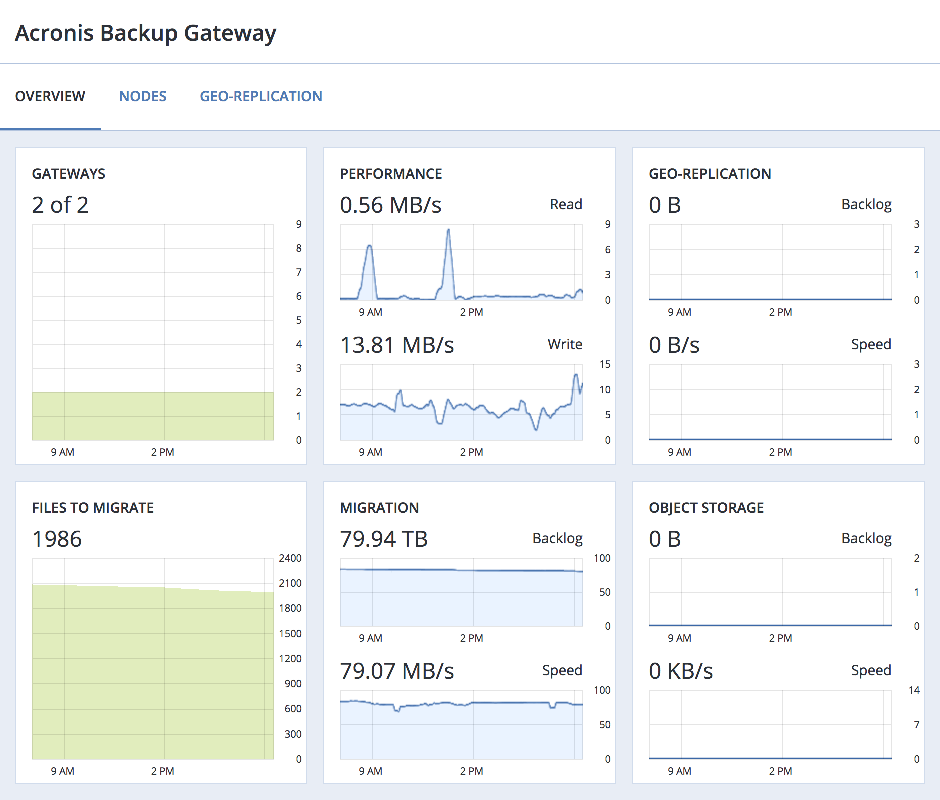
6.10. Monitoring Backup Gateway
After you create a Backup Gateway, you can monitor it on the Storage services > Backup storage > Overview screen. The charts show the following information:
- The performance of Backup Gateway services
- The geo-replication speed and backlog (the amount of data waiting to be replicated)
- Object storage speed and backlog (the amount of data waiting to be uploaded to public cloud)
- Migration speed and backlog (the amount of data waiting to be migrated)
- How many files are left in migration queue
If you migrate backups from Acronis Storage 1.5 or 1.7, migration backlog will be larger than the amount of data on the source storage. The reason is that Acronis Storage versions prior to 2.x use the old backup (FES) protocol, which sends more data over a network. The difference between source data size and backlog also very much depends on the retention policy utilized by the backup solution. Despite this, the resulting space occupied by migrated data on the destination will be similar to that on the source.
If backlogs do not decrease over time, it means the data cannot be replicated, migrated, or uploaded fast enough. The reason may be insufficient network transfer speed, and you may need to check or upgrade your network.
6.10.1. Advanced Backup Gateway monitoring via Grafana
For advanced monitoring of the Backup Gateway cluster, go to the Monitoring > Dashboard screen, and then click Grafana dashboard. A separate browser tab will open with preconfigured Grafana dashboards, two of which are dedicated to Acronis Backup Gateway. To see a detailed description for each chart, click the i icon in the left corner.
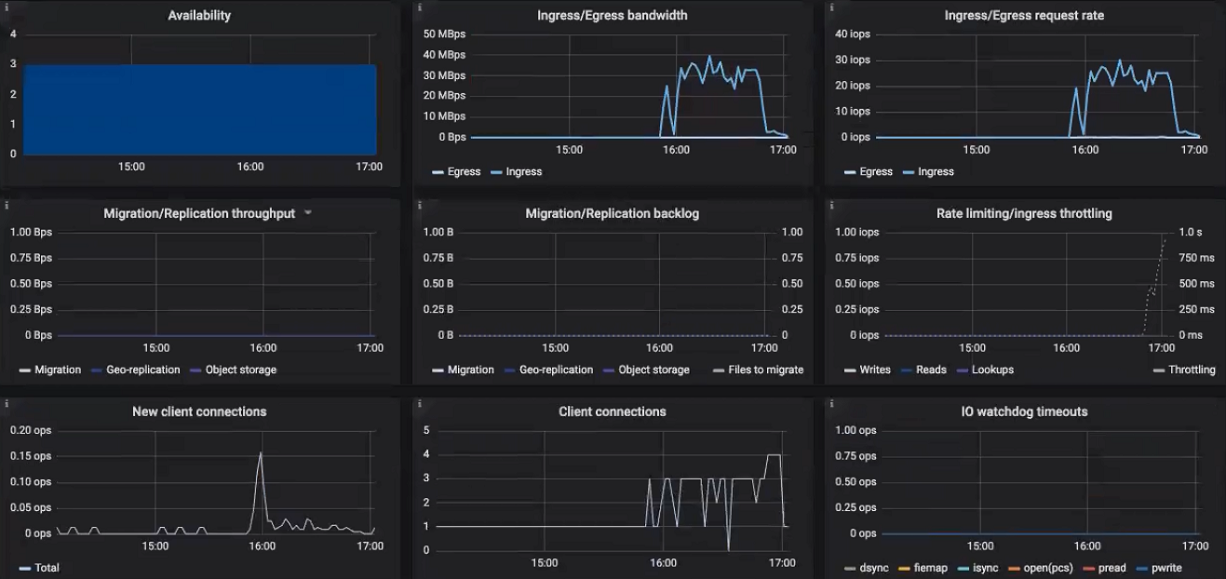
On the Acronis Backup Gateway dashboard, you need to pay attention to the following charts:
Availability. Any time period during which the gateways have not been available will be highlighted in red. In this case, you will need to look into the logs on the nodes with the failed service and report a problem. To see the Backup Gateway log, use the following command:
# zstdcat /var/log/vstorage/abgw.log.zst
Migration/Replication throughput. The migration chart should be displayed during migration or if the cluster serves as master in a geo-replication configuration. The replication chart should mirror the ingress bandwidth chart.
Migration/replication backlog. The migration chart should decrease over time. The replication chart should be near zero, high values indicate network issues.
Rate limiting/ingress throttling. If the chart is not empty, it means the underlying storage lacks free space and the Backup Gateway is throttling user requests to slow down the data flow. Add more storage space to the cluster to solve the issue. For more information, refer to https://kb.acronis.com/content/62823.
New client connections. A high rate of failed connections due to SSL certificate verification problems on the chart means that clients uploaded an invalid certificate chain.
IO watchdog timeouts. If the chart is not empty, it means the underlying storage is not healthy and cannot deliver the required performance.
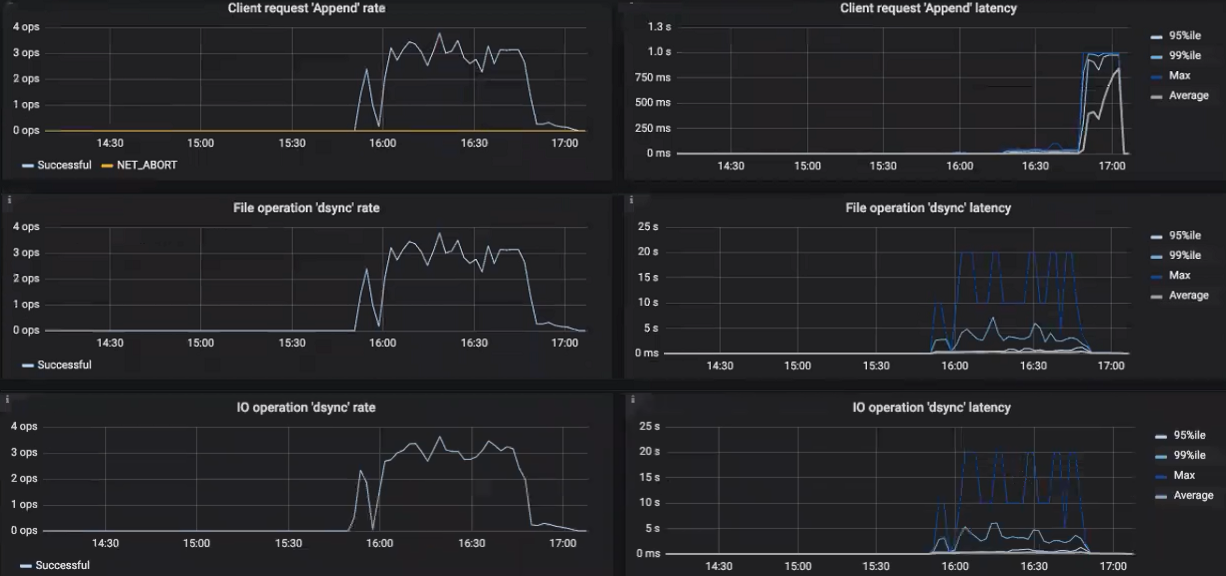
To see the charts for a particular client request, file, and I/O operation, choose them from the drop-down menus above. A high rate of failed requests or operations and high latencies on these charts indicate that the Backup Gateway experiences issues that need to be reported. For example, you can check charts for the “Append” request:
- The Append rate chart displays the backup data flow from backup agents to the storage in operations per second (one operation equals one big block of backup data; blocks can be of various size).
- The Append latency chart shows the time spent on processing requests and should average several tens of milliseconds with peak values below one second.
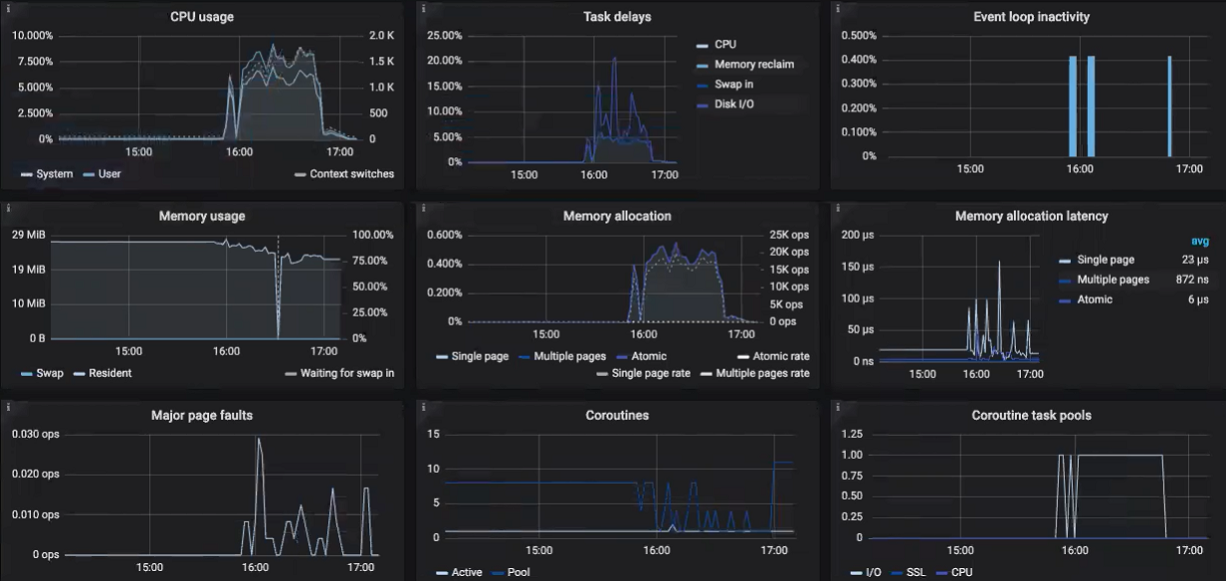
The Acronis Backup Gateway Details dashboard is intended for low-level troubleshooting by the support team. To monitor a particular node, client request, file, and I/O operation, choose them from the drop-down menus above. On the dashboard, you can make sure the Event loop inactivity chart is empty. Otherwise, the Backup Gateway is not healthy on this node and the issue needs to be reported.