7.6. Monitoring target groups
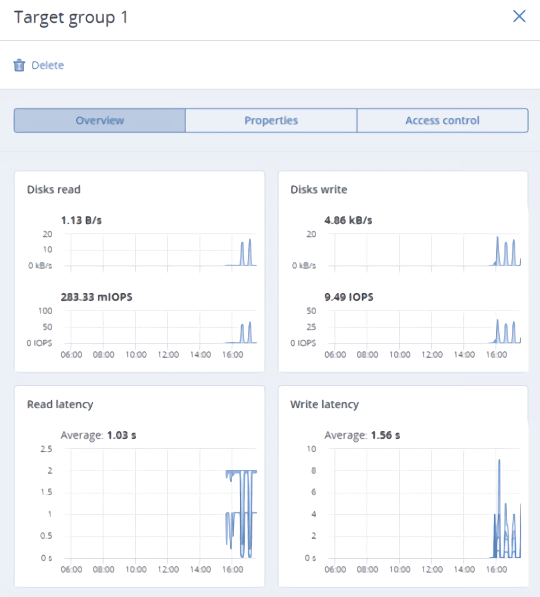
After creating a target group, you can monitor it on the Overview tab. The charts show the read and write I/O activity and latency across all LUNs attached to the target group.

7.6.1. Advanced iSCSI monitoring via Grafana
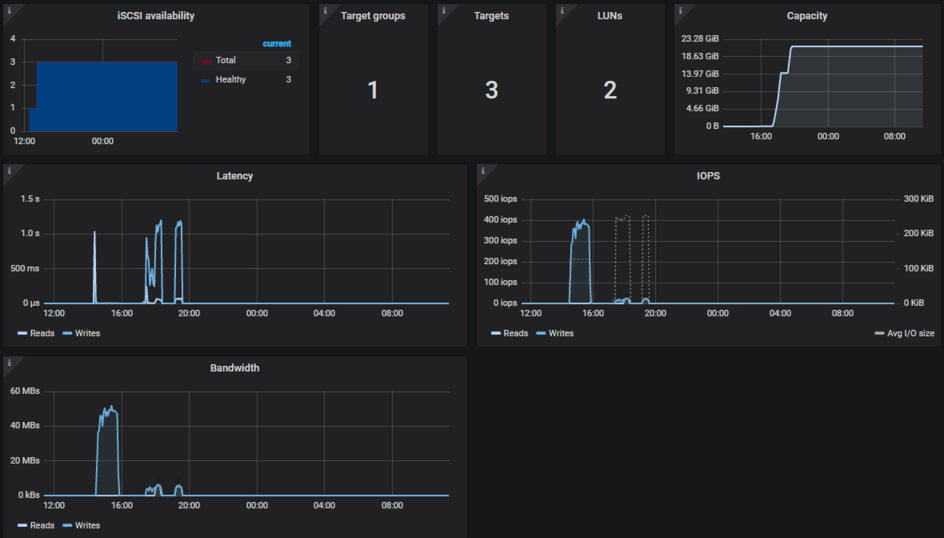
For advanced monitoring of target groups, go to the Monitoring > Dashboard screen, and then click Grafana dashboard. A separate browser tab will open with preconfigured Grafana dashboards. Two of them are dedicated to the iSCSI service. To see a detailed description for each chart, click i in the chart’s top left corner.
On the iSCSI overview dashboard, note the following charts:
- iSCSI availability. The chart shows target availability. Time periods when the targets have not been available will be highlighted in red. In this case, check
/var/log/vstorage/iscsi/vstorage-target-monitor.logon the nodes with the failed service and report a problem. - Latency. The chart shows the time spent on read and write I/O operations across all iSCSI LUNs. It should average a few dozens of milliseconds with peak values below 1s.

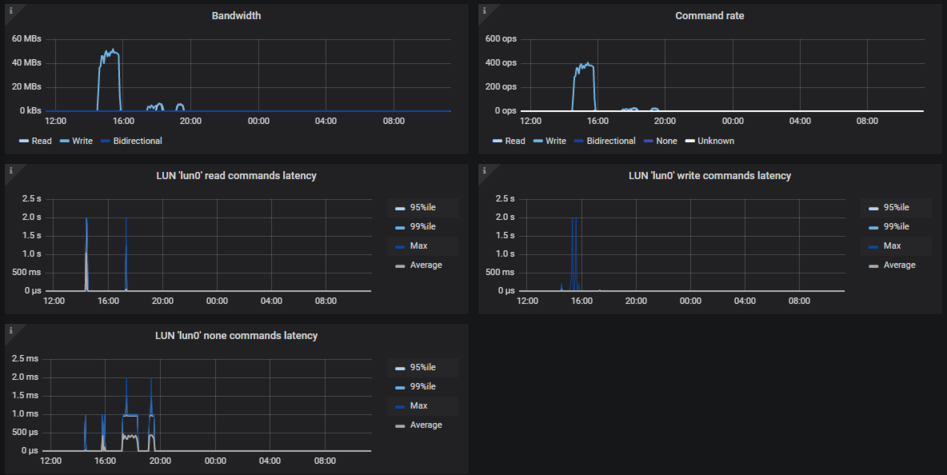
The iSCSI details dashboard is intended for troubleshooting by the technical support team. To monitor a particular target group, target, session, or LUN, select it from a drop-down list above.

Oct 06, 2020
