2. Monitoring Cluster Storage Space
You can monitor cluster storage space on the cluster OVERVIEW screen. Typical statistics may look like this:
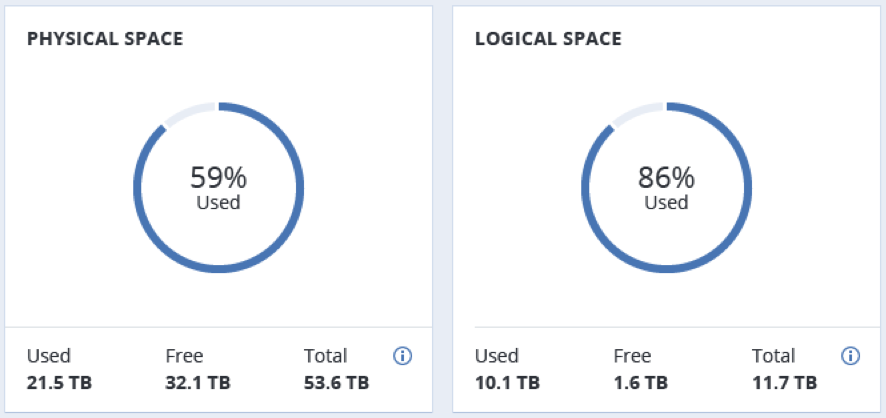
The two charts that provide information on how storage space is used are PHYSICAL SPACE and LOGICAL SPACE. They are described in the following sections in more detail.
2.1. Physical Space Chart
The PHYSICAL SPACE chart shows the combined space of all disks available to the cluster. The following statistics are available:
- Used space. The space occupied by all data chunks and their replicas plus the space occupied by any other data stored on cluster nodes’ disks.
- Free space. The unused space on all cluster nodes’ disks.
- Total space. The total space on all cluster nodes’ disks.
2.2. Logical Space Chart
The LOGICAL SPACE chart represents all the space that can be allocated and used by the cluster for storing user data. This space includes the following:
- Total space. The maximum disk space available as defined by license.
- Used space. The space occupied exclusively by user data. Replicas and erasure coding metadata are not taken into account.
- Free space. The difference between the two above.
2.2.1. Understanding Logical Space
When monitoring disk space information in the cluster, keep in mind that logical space is the amount of free disk space that can be used for storing user data in the form of data chunks and all their replicas. Once this space runs out, no data can be written to the cluster.
To better understand how logical disk space is calculated, consider the following example:
- The cluster has three disks with the storage role. The first disk has 200 GB of space, the second one has 500 GB, and the third one has 1 TB.
- If the redundancy mode is set to three replicas, each data chunk must be stored as three replicas on three different disks with the storage role.
In this example, the available logical disk space will be 200 GB, that is, equal to the capacity of the smallest disk with the storage role. The reason is that each replica must be stored on a different disk. So once the space on the smallest disk (i.e. 200 GB) runs out, no new chunk replicas can be created unless a new disk with the storage role is added or the redundancy mode is changed to two replicas.
With the two replicas redundancy mode, the available logical disk space would be 700 GB, because the two smallest disks combined can hold 700 GB of data.
2.3. Monitoring Chunk Status and Replication
You can monitor the state of all chunks in the cluster in the CHUNKS section of the cluster OVERVIEW screen.
The table below lists all possible states a chunk can have.
| State | Description |
|---|---|
| healthy | Percentage of chunks that have enough active replicas. The normal state of chunks. |
| offline | Percentage of chunks all replicas of which are offline. Such chunks are completely inaccessible for the cluster and cannot be replicated, read from or written to. All requests to an offline chunk are frozen until a CS that stores that chunk’s replica goes online. Get offline cluster nodes back online as soon as possible to avoid data loss. |
| blocked | Percentage of chunks which have fewer active replicas than the set minimal amount. Write requests to a blocked chunk are frozen until it has at least the set minimum amount of replicas. Read requests to blocked chunks are allowed, however, as they still have some active replicas left. Blocked chunks have higher replication priority than degraded chunks. Having blocked chunks in the cluster increases the risk of losing data, so postpone any maintenance on working cluster nodes and get offline chunk servers back online as fast as possible. |
| degraded | Percentage of chunks with the number of active replicas lower than normal but equal to or higher than the set minimum. Such chunks can be read from and written to. |
2.4. Monitoring Cluster Services
You can monitor two types of services in the SERVICES section on the cluster OVERVIEW screen:
- MDS, metadata services. Ensure that five are running at all times.
- CS, chunk services. With this chart, you can also keep track of all disks with the storage role.
Typical statistics may look like this:
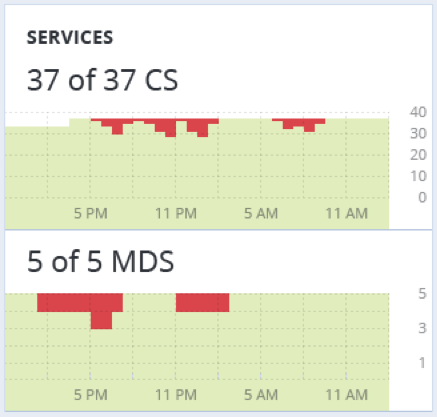
If some of the services were not in the healthy state for some time, these time periods will be highlighted in red on the charts.
2.5. Monitoring Cluster I/O Activity
You can monitor the history of the cluster I/O activity on the READ and WRITE charts on the cluster OVERVIEW screen. Typical statistics may look like this:
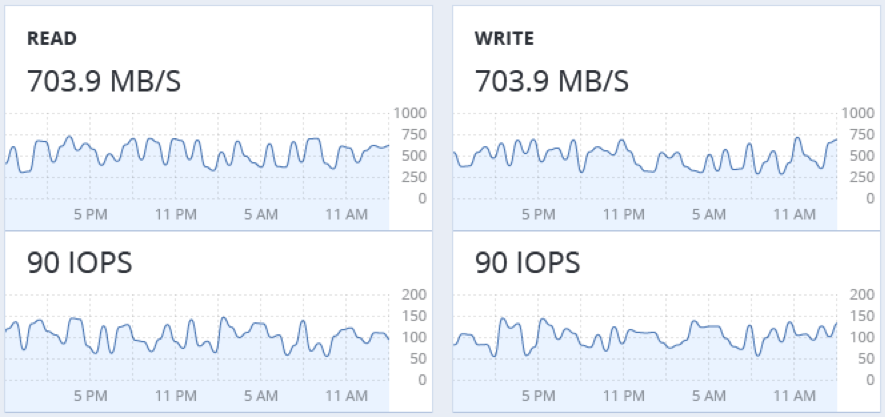
The current cluster I/O activity averaged for the last 10 seconds is shown as:
- the speed of read and write I/O operations, in megabytes per second (MB/s).
- the number of read and write I/O operations per second (IOPS).