8.10. Monitoring S3
You can monitor the S3 cluster and its components on the Storage services > S3 > Overview screen with the following charts:
- Availability of NS, OS, and GW services. If an S3 GW service has the “failed” status, most probably the node hosting it is down. It is not critical for the S3 cluster: high availability of the S3 service is based on the DNS records. If the DNS records are properly configured, the S3 service remains fully accessible via S3 clients. On the other hand, if an OS or NS service fails, it is critical: the whole S3 cluster cannot operate normally. If you see that some of the NS or OS services are offline, but all of the cluster nodes are healthy, and the network with the OSTOR private traffic type is working well, contact the techical support team. You can also refer to the Grafana dashboards to find out the failure causes.
- Operation rate. The chart shows the overall cluster load by S3 users’ requests, including all operation types.
- Request failure rate. The requests are generated by users or their applications. Some requests cannot be processed: for example, they may request nonexistent objects, or mismatch the access rights, or use unsupported features (refer to Supported Amazon S3 features). So, it is normal if the error rate makes up a small proportion of the total operations rate. However, it can also indicate that the S3 application used for access is not working properly. In addition, if the S3 cluster is open for public access, it might be scanned by Internet crawlers. In this case, the error spikes would reflect all the issues with their mismatching access rights. It is not a critical issue for the cluster though.
- Bandwidth. The chart shows the overall cluster load by the S3 users’ requests.
- PUT latency and GET latency. These values are measured from the time the last byte of the user request was received until the time the first byte of the response was sent.
8.10.1. Advanced S3 monitoring via Grafana
For advanced monitoring of the S3 cluster, go to the Storage services > S3 > Overview screen, and then click Grafana dashboard. A separate browser tab will open with preconfigured Grafana dashboards. To see a detailed description for each chart, click the i icon in its left corner.
For the detailed monitoring of the OS and NS services, use the Object Storage overview, Object Storage OS details, and Object Storage NS details dashboards. Filter the data by nodes or volumes to detect the ones with abnormal service usage. Note the Task delays chart: it shows the proportion of time wasted on waiting for CPU, for available memory (reclaim), for memory transfer from swap (swap in), and for I/O completion.
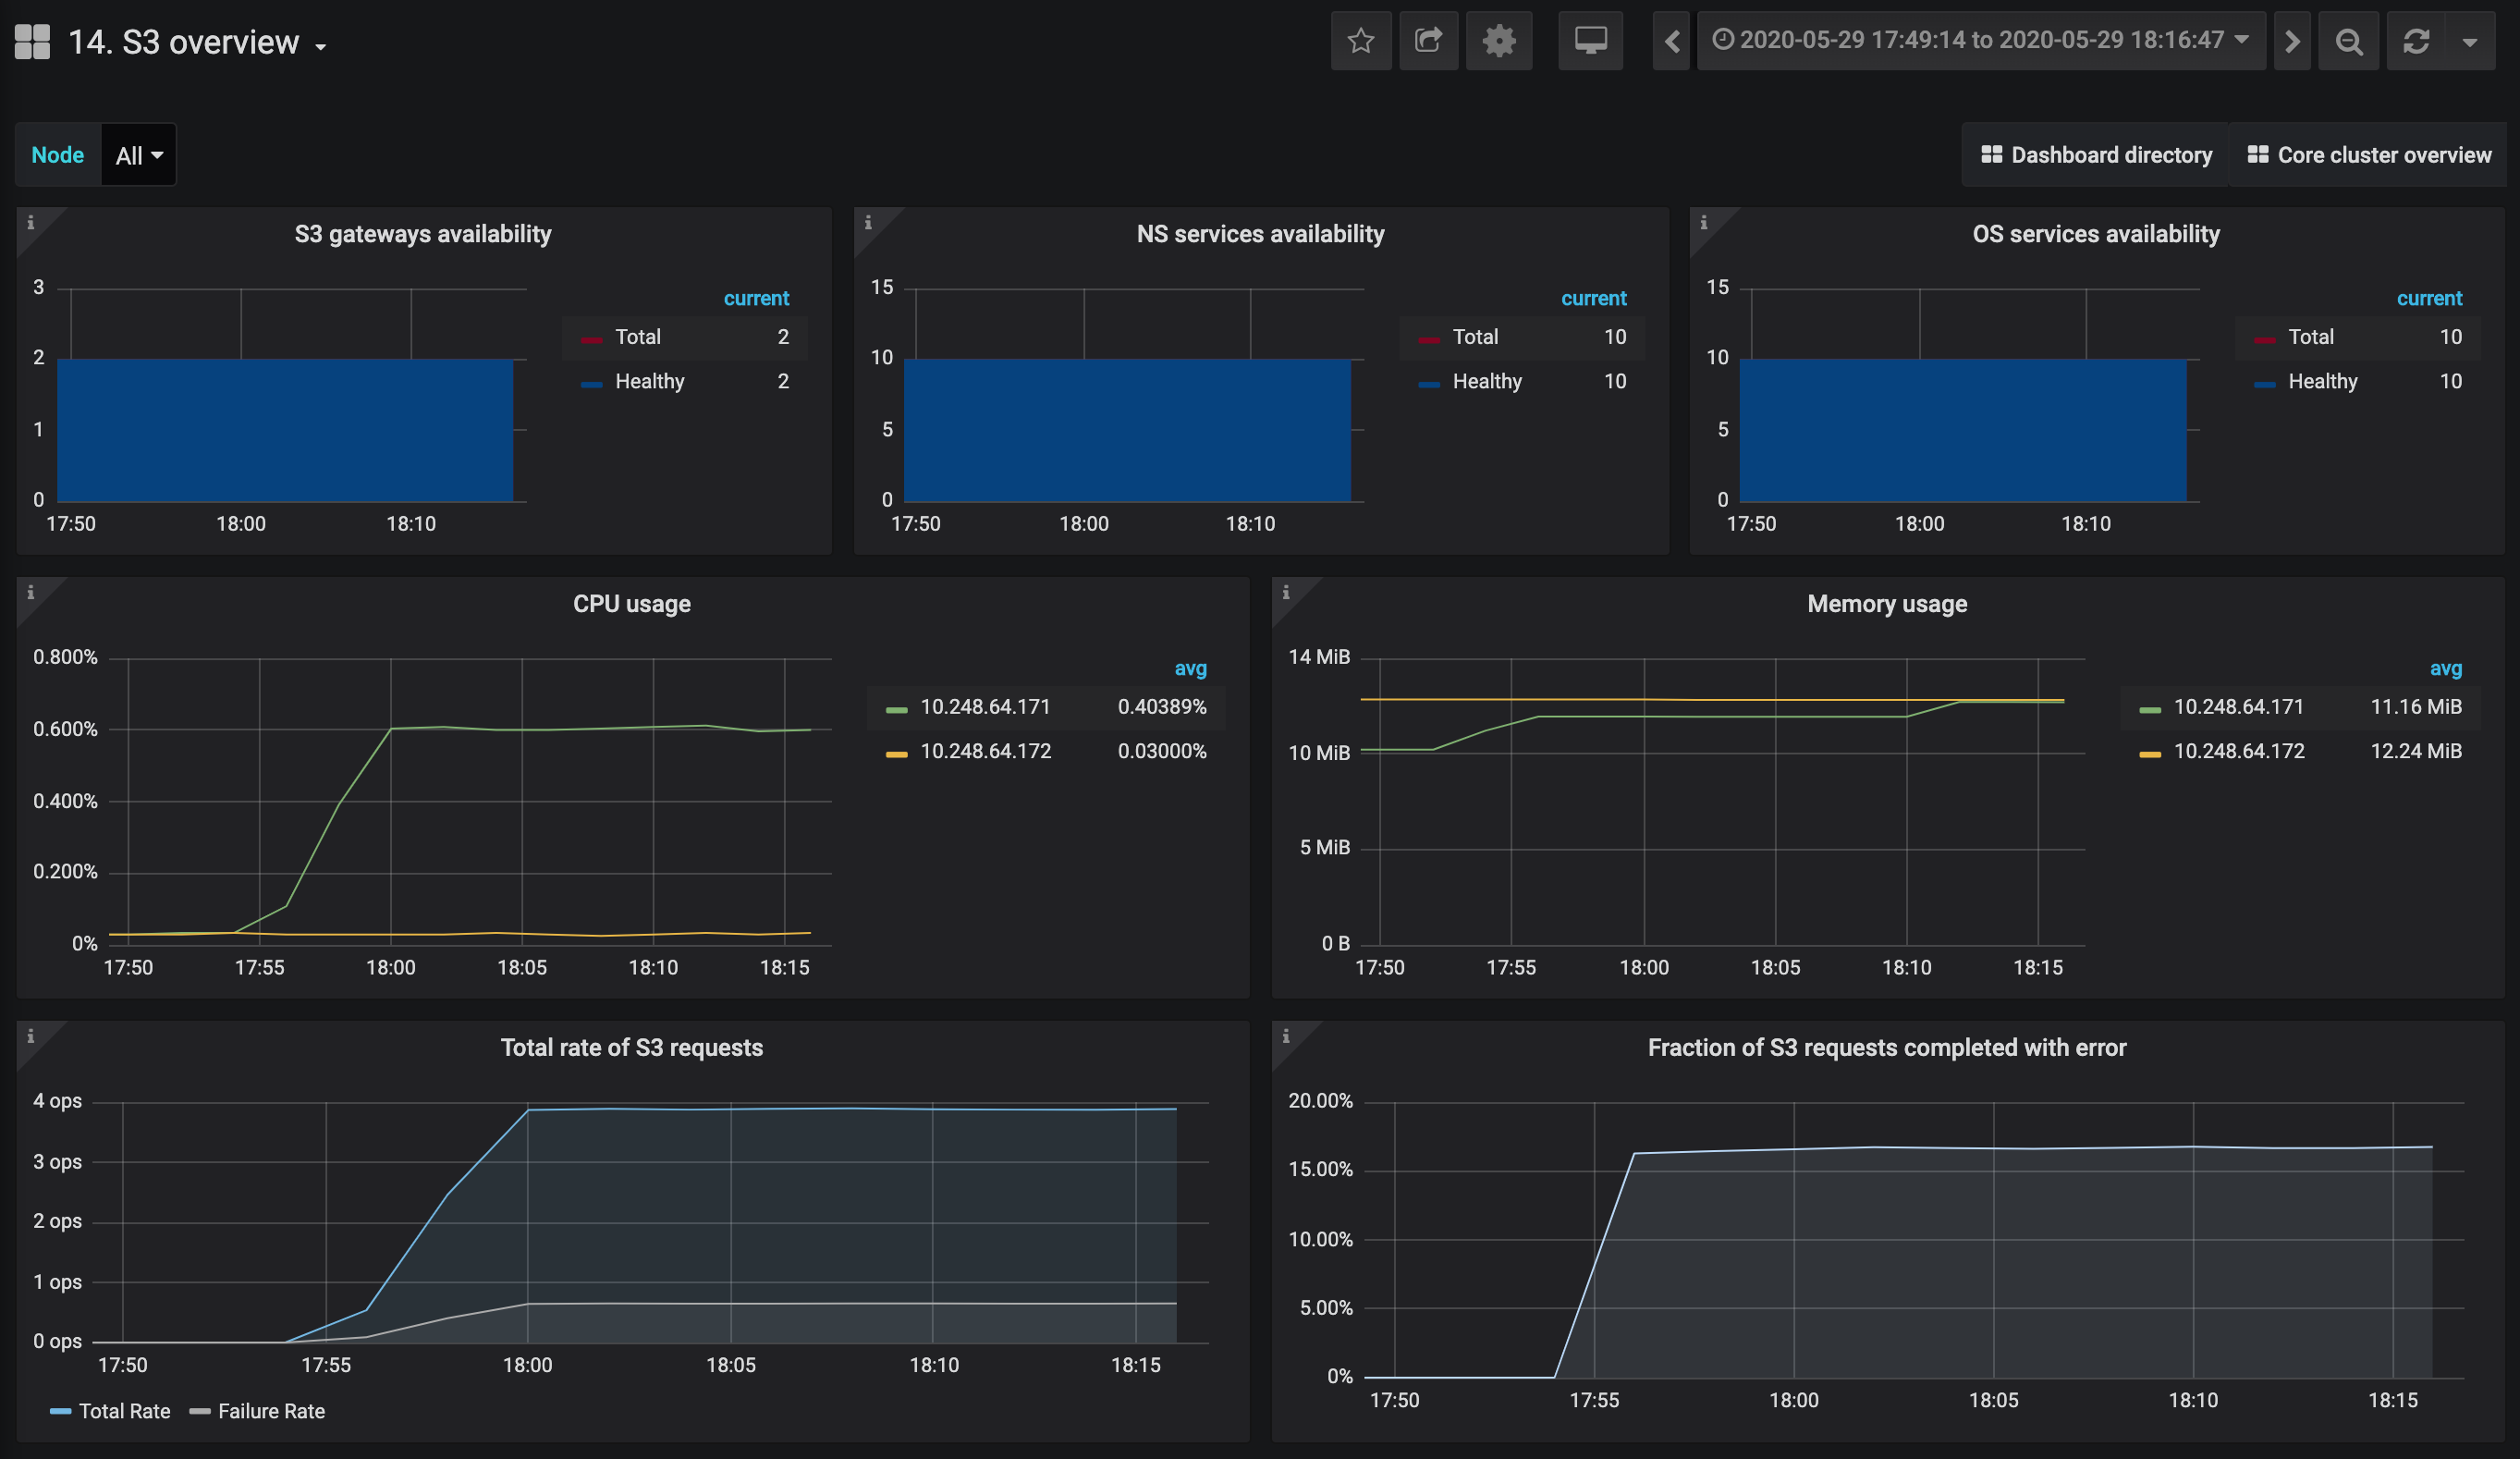
The S3 overview dashboard shows primarily the S3 GW service information. Here, you can monitor the object storage and S3 interface with the following charts:
- S3 gateways availability, NS services availability, and OS services availability. The charts show the information on the corresponding S3 services. Time periods when the services are unavailable are highlighted in red.
- GET latency and PUT latency. The charts show the average latency and 95th, 99th, and max latency percentiles of S3 GET and PUT requests. This value is measured from the time the last byte of the request was received until the time the first byte of the response was sent.
- Bandwidth. The chart shows the total amount of read or write operations passing through all S3 gateways per second.
- Operation rates. The chart shows the total number of GET, PUT, LIST, and DELETE S3 operations per second across all S3 gateways.

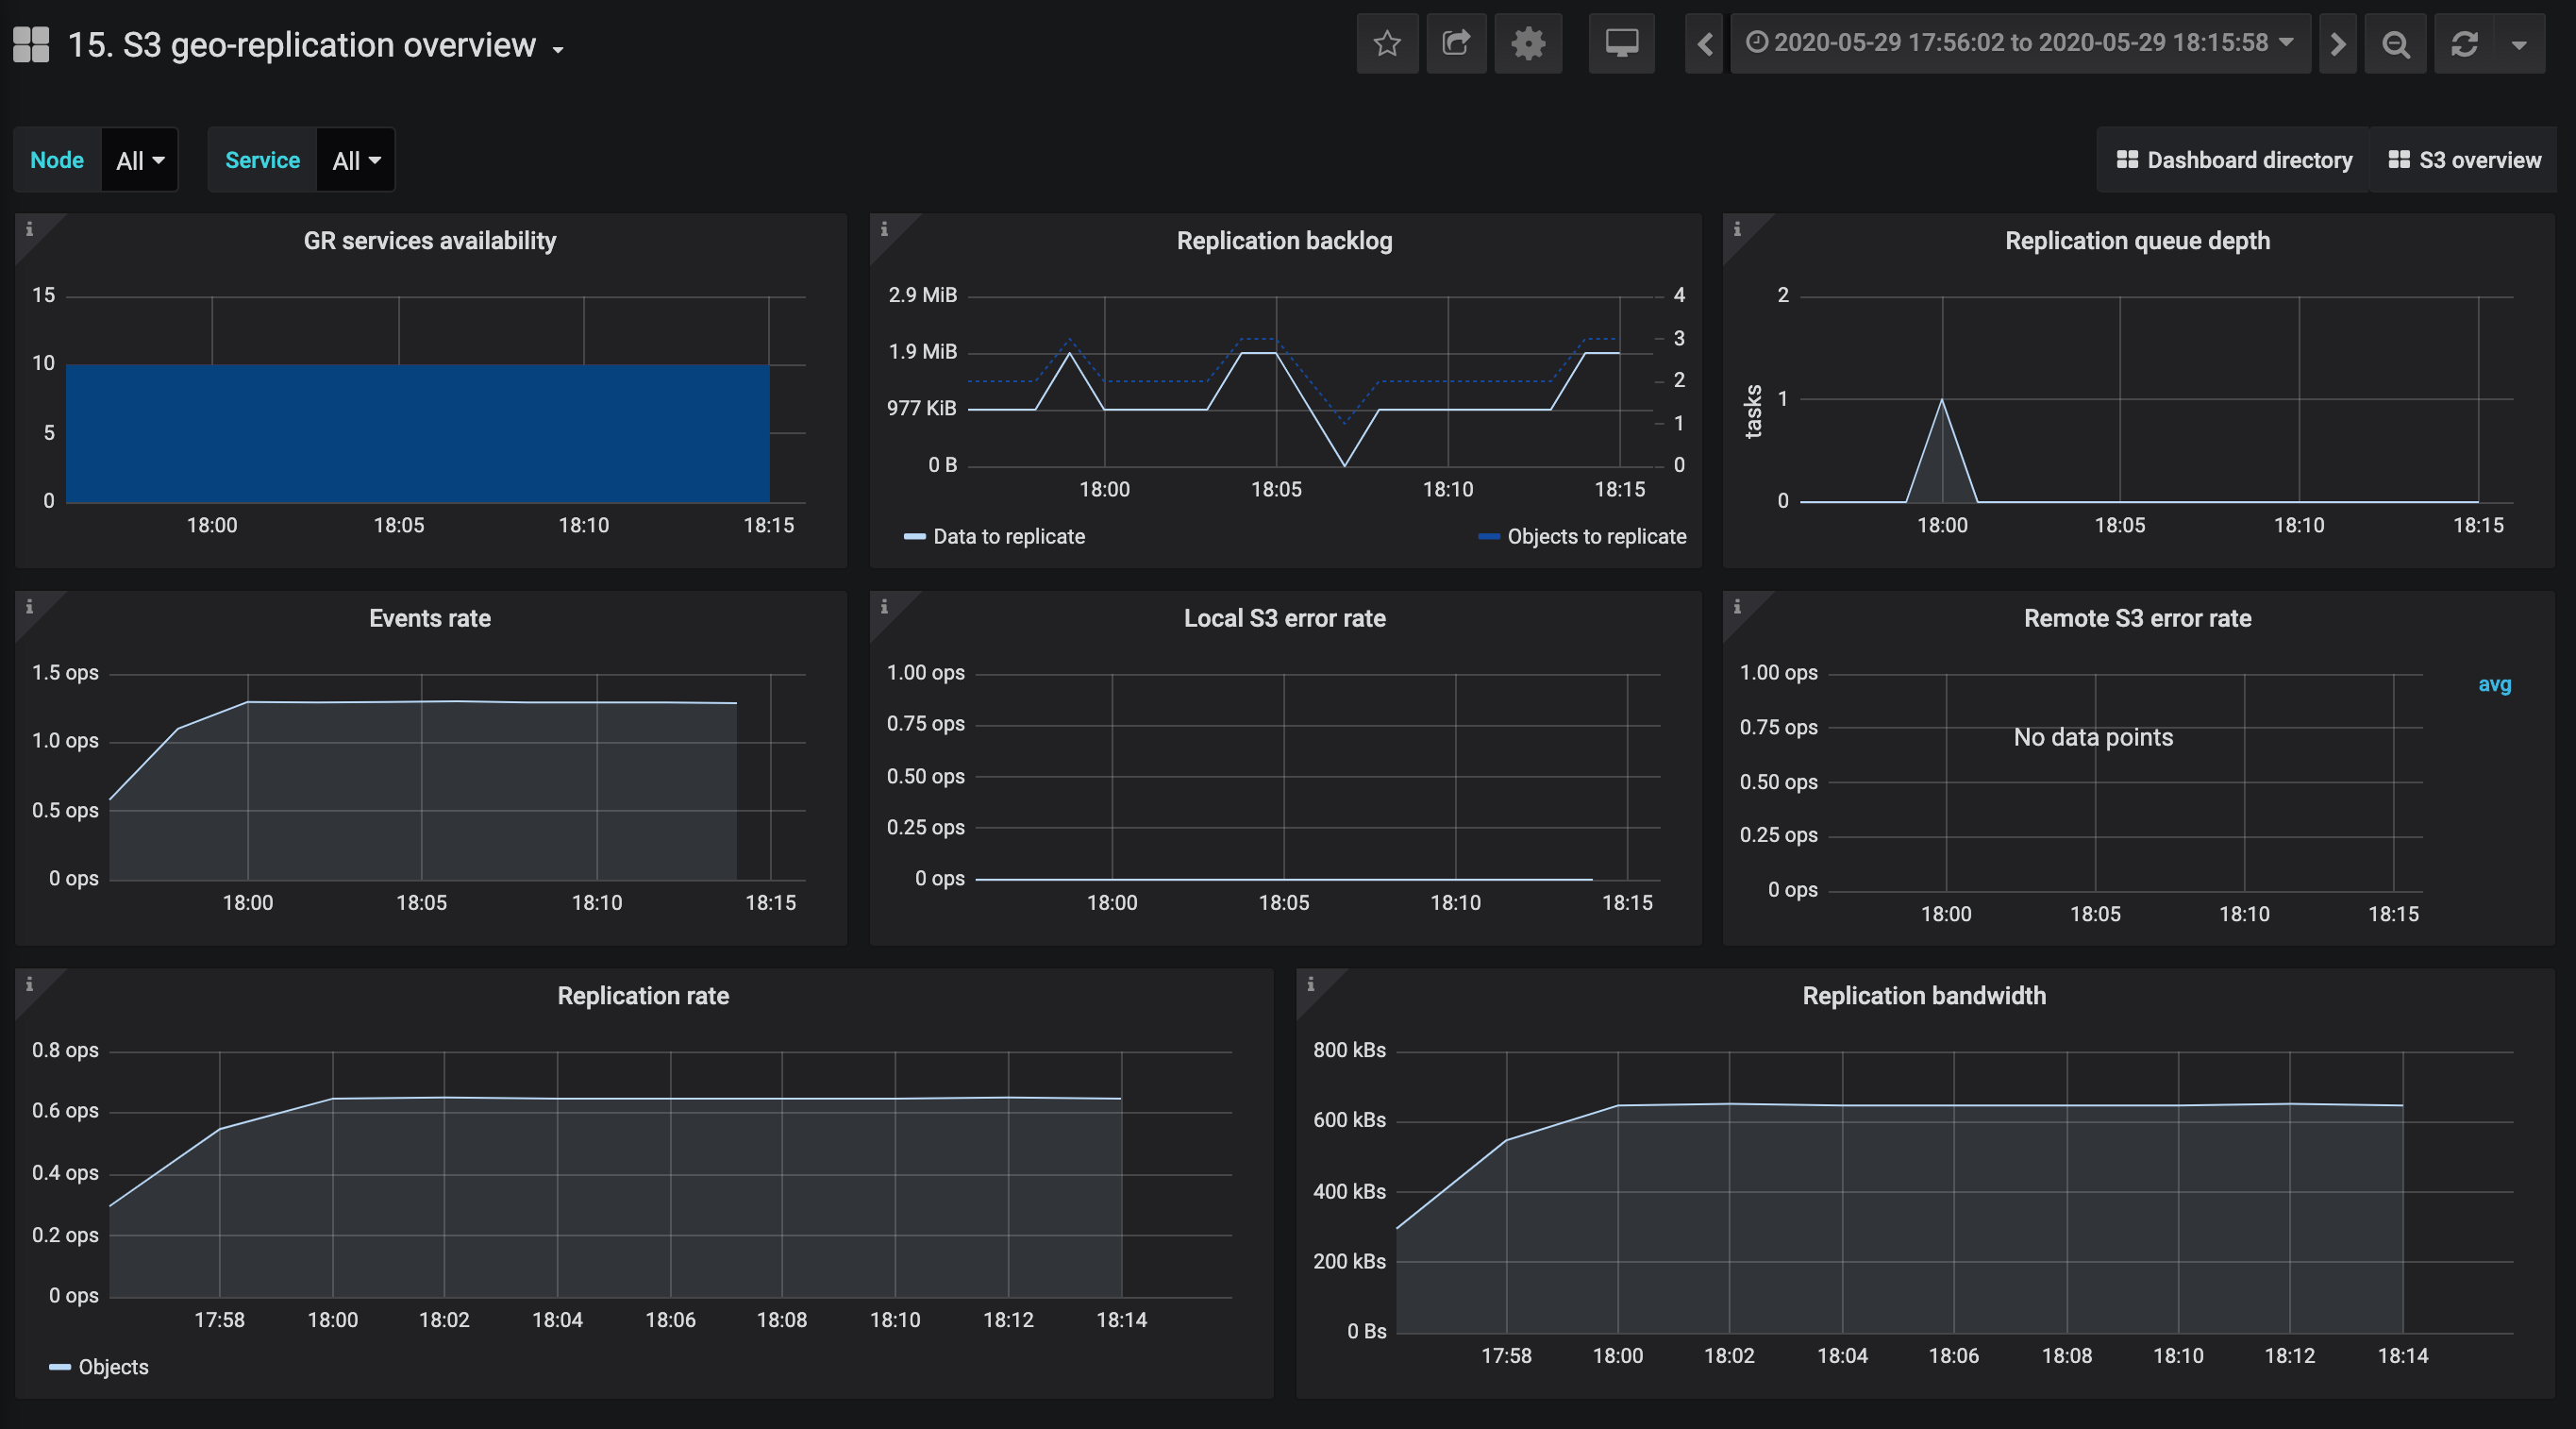
The S3 geo-replication overview dashboard is intended for monitoring data replicated in multiple geographically distributed datacenters:
- Replication backlog and Replication queue depth are the most important charts here. If the values are growing constantly, the replication efficiency is falling. It means that the cluster receives more data than it sends.
- Local S3 error rate and Remote S3 error rate help locate connection problems. A small number of errors is possible if the clusters are replicated over the Internet with unstable latency.

