9.6. Monitoring NFS
For advanced monitoring of NFS nodes, services, and shares, go to the Monitoring > Dashboard screen, and then click Grafana dashboard. A separate browser tab will open with preconfigured Grafana dashboards. Three of them are dedicated to the NFS service. To see a detailed description for each chart, click i in the chart’s top left corner.
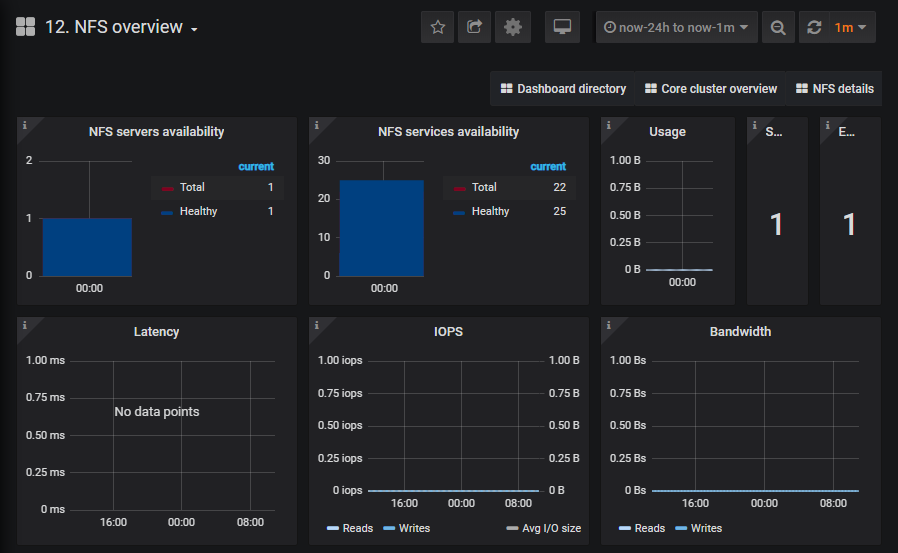
On the NFS overview dashboard, note the following charts:
- NFS servers availability. The chart shows the availability of NFS hosts. Time periods when the hosts are unavailable will be highlighted in red. In this case, check
/var/log/ganesha/ganesha.logand/var/log/ostor/ostorfs.logon these nodes, and report a problem. - NFS services availability. The chart shows the availability of FS and OS services used by NFS. Time periods when the services are unavailable will be highlighted in red. In this case, check
/var/log/ostor/FS-*and/var/log/ostor/OS-*on the corresponding nodes, and report a problem. - Latency. The chart shows the average latency of read and write I/O operations across all NFS shares.
- IOPS. The chart shows the total numbers of read and write I/O operations, along with their average I/O operations per second across all NFS shares.
- Bandwidth. The chart shows the total amount of data read from, or written to, all NFS shares per second.

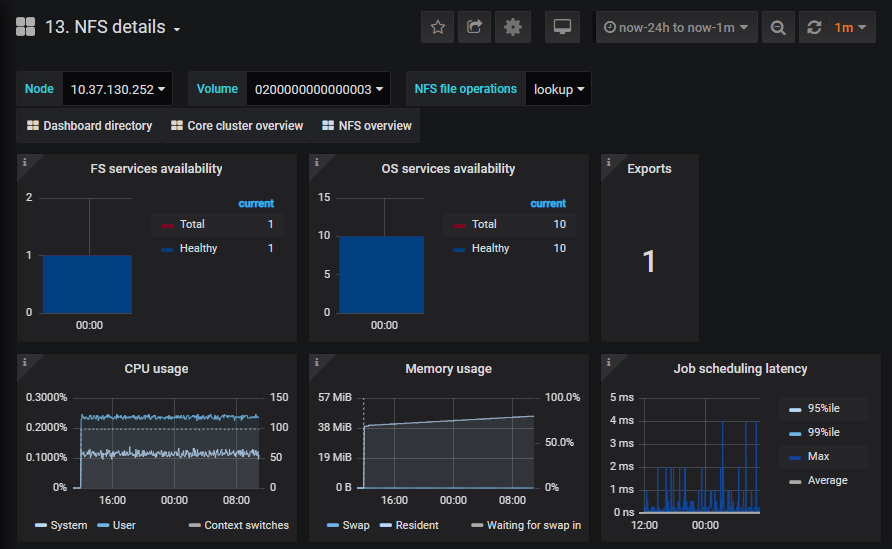
The NFS details dashboard is intended for monitoring particular nodes, volumes, or NFS file operations.

The Object Storage FS details dashboard is intended for monitoring data on particular file services.
Oct 06, 2020
