I/O activity charts
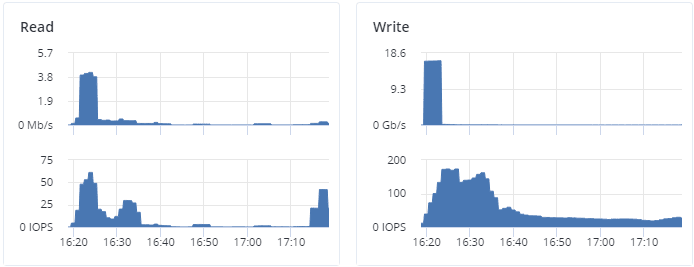
The Read and Write charts show the history of the cluster I/O activity as the speed of read and write I/O operations in megabytes per second, and the number of read and write I/O operations per second (IOPS). For example:
|
|
|
Last build date: Thursday, April 10, 2025 Administrator Guide for Acronis Cyber Infrastructure4.0. © Acronis International GmbH, 2003-2025 |