3.3. Monitoring Storage Cluster Objects via SNMP
You can monitor cluster objects via the Simple Network Management Protocol (SNMP). The implementation conforms to the same Structure of Management Information (SMI) rules as the data in the standard SNMP context: all objects are organized in a tree; each object identifier (OID) is a series of integers corresponding to tree nodes and separated by dots.
General information:
- The OID of the root subtree with all the objects you can monitor is 1.3.6.1.4.1.8072.161.1.
- The
VSTORAGE-MIB.txtinformation base file is required to monitor the objects. You can download the file athttps://<admin_panel_IP>:8888/api/v2/snmp/mibs/.
The following subsections describe ways to enable and use SNMP to monitor cluster objects.
3.3.1. Enabling SNMP Access
To monitor cluster objects, enable the SNMP access on the node. Do the following in the admin panel:
Open UDP port 161 on the management node as follows:
- On the INFRASTRUCTURE > Networks screen, click Edit.
- Add the SNMP traffic type to your public network by ticking the corresponding checkbox.
- Click Save to apply changes.
On the SETTINGS > Advanced settings > SNMP tab, check Enable SNMP on the management node. The network management system (SNMP monitor) will be enabled, giving you access to the cluster via the SNMP protocol.
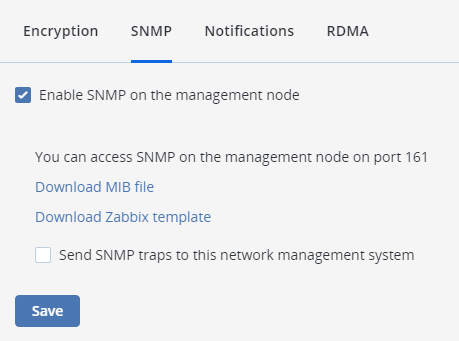
Click the provided link to download the MIB file and set it up in your SNMP monitor.
If required, have Acronis Cyber Infrastructure send SNMP traps to your SNMP monitor. Do the following:
Check Send SNMP traps to this network management system.
Specify the IP address, Port, and Community of the network management system.
By default, the
snmptrapddaemon uses port 162. The default community ispublic.If required, click Send test trap to test the service.
Click Save to apply changes.
3.3.2. Accessing Storage Cluster Information Objects via SNMP
You can access storage cluster information objects with SNMP tools of your choice, e.g., the free Net-SNMP suite for Linux.
To obtain storage cluster information on a node with the admin panel, place the MIB file to /usr/share/snmp/mibs and run the snmpwalk command. For example:
# snmpwalk -M /usr/share/snmp/mibs -m VSTORAGE-MIB -v 2c -c public localhost:161 VSTORAGE-MIB:cluster
Typical output may be the following:
VSTORAGE-MIB::clusterName.0 = STRING: "cluster1"
VSTORAGE-MIB::healthStatus.0 = STRING: "healthy"
VSTORAGE-MIB::usedLogicalSpace.0 = Counter64: 173732322
VSTORAGE-MIB::totalLogicalSpace.0 = Counter64: 1337665179648
VSTORAGE-MIB::freeLogicalSpace.0 = Counter64: 1318963253248
VSTORAGE-MIB::licenseStatus.0 = STRING: "unknown"
VSTORAGE-MIB::licenseCapacity.0 = Counter64: 1099511627776
VSTORAGE-MIB::licenseExpirationStatus.0 = STRING: "None"
VSTORAGE-MIB::ioReadOpS.0 = Counter64: 0
VSTORAGE-MIB::ioWriteOpS.0 = Counter64: 0
VSTORAGE-MIB::ioReads.0 = Counter64: 0
VSTORAGE-MIB::ioWrites.0 = Counter64: 0
VSTORAGE-MIB::csActive.0 = Counter64: 11
VSTORAGE-MIB::csTotal.0 = Counter64: 11
VSTORAGE-MIB::mdsAvail.0 = Counter64: 4
VSTORAGE-MIB::mdsTotal.0 = Counter64: 4
<...>
3.3.2.1. Listening to SNMP Traps
To start listening to SNMP traps, do the following:
Configure the
snmptrapddaemon to log SNMP traps, allow them to trigger executable actions, and resend data to the network. To do this, uncomment the followingpubliccommunity string in the/etc/snmp/snmptrapd.conffile:authCommunity log,execute,net public
Configure the firewall to allow inbound traffic on UDP port 162.
Download the
VSTORAGE-MIB.txtfile and place it to the/usr/share/snmp/mibsdirectory.Start the daemon and specify the MIB file:
# snmptrapd -M /usr/share/snmp/mibs -m VSTORAGE-MIB -n -f
By default, traps will be logged to
/var/log/messages. You can redirect them to a custom log file with the-Lf <path>option. For example:# snmptrapd -M /usr/share/snmp/mibs -m VSTORAGE-MIB -n -f -Lf /tmp/traps.log
Send a test trap from the SETTINGS > Advanced settings > SNMP tab in the admin panel.
View the log file:
# tail -f /tmp/traps.log
2019-10-14 12:51:50 node001.vstoragedomain [UDP: [10.94.80.22]:40029->\
[10.94.80.22]:162]:#012DISMAN-EVENT-MIB::sysUpTimeInstance = Timeticks: \
(111150521) 12 days, 20:45:05.21#011SNMPv2-MIB::snmpTrapOID.0 = OID: \
NET-SNMP-MIB::netSnmp.161.3.100#011NET-SNMP-MIB::netSnmp.161.2.1 = STRING: "TestTrap"\
#011NET-SNMP-MIB::netSnmp.161.2.2 = STRING: "It is the test trap from VStorage"\
#011NET-SNMP-MIB::netSnmp.161.2.3 = Counter64: 0
3.3.3. Monitoring the Storage Cluster with Zabbix
To configure cluster monitoring in Zabbix, do the following:
On the SETTINGS > Advanced settings > SNMP tab, click the provided link to download a template for Zabbix.
Note
The template is compatible with Zabbix 3.x.
In Zabbix, click Configuration > Templates > Import and Browse.
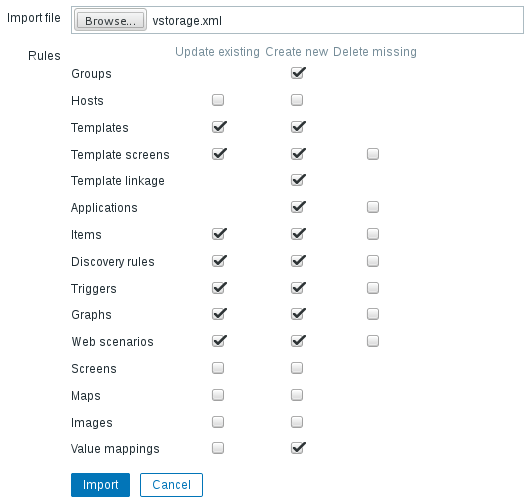
Navigate to the template, select it, and click Import.
Click Configuration > Hosts > Create host.
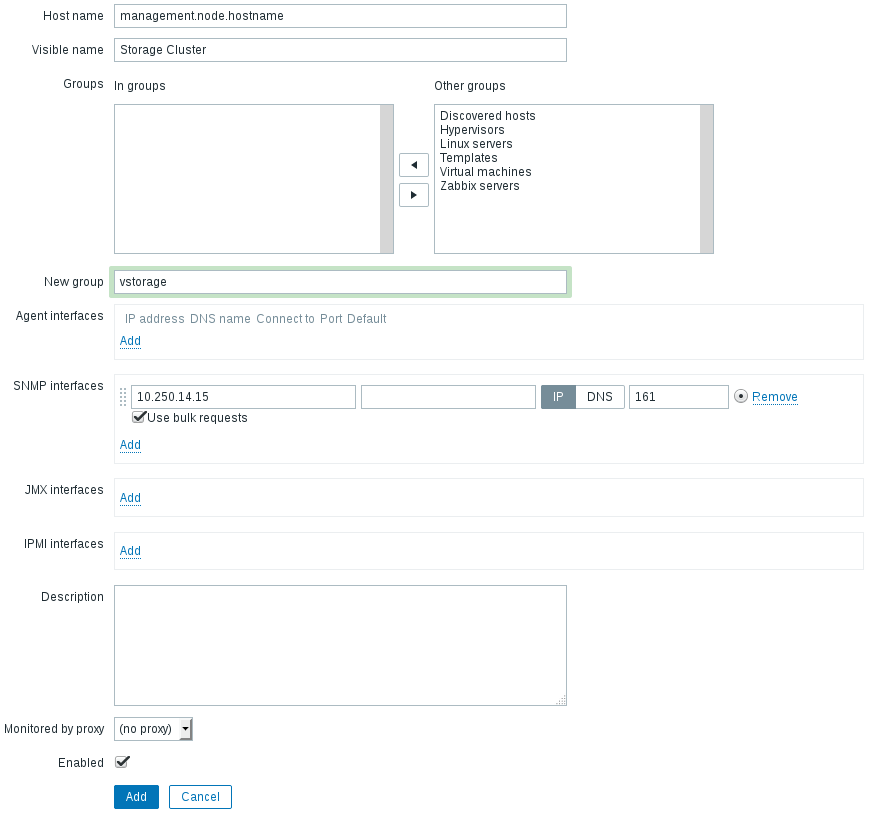
On the Host tab, do the following:
- Specify the Host name of the management node and its Visible name in Zabbix.
- Specify
vstoragein the New group field. - Remove the Agent Interfaces section.
- Add an SNMP interfaces section and specify the management node IP address.
On the Templates tab, click Select next to the Link new templates field.
In the Zabbix Server: Templates window, check the
Template VStorageSNMPtemplate and click Select.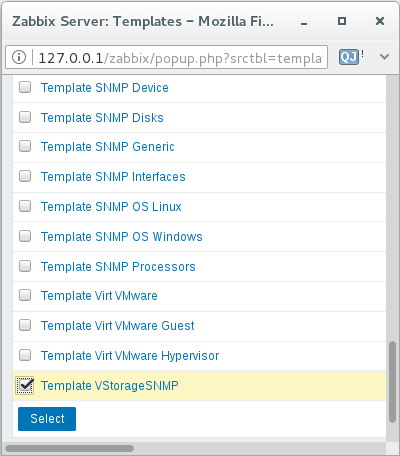
Back on the Templates tab, click the Add link in the Link new templates section. The
VStorageSNMPtemplate will appear in the Linked templates group.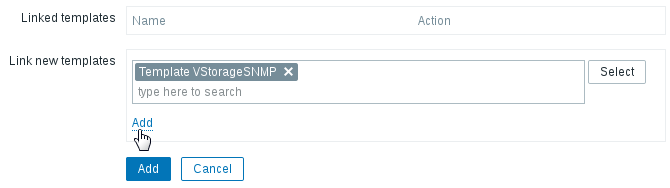
Having configured the host and added its template, click the Add button.
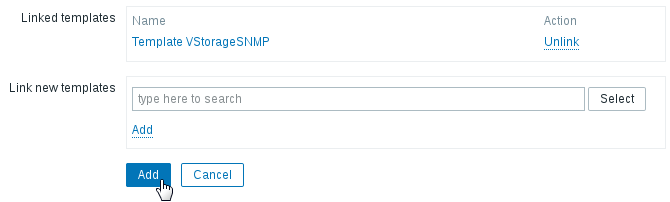
In a few minutes, the cluster’s SNMP label in the Availability column on the Configuration > Hosts screen will turn green.

To monitor cluster’s parameters, open the Monitoring > Latest data screen, set the filter’s Host groups to vstorage and click Apply.
You can create performance charts on the Configuration > Hosts > <cluster> > Graphs tab and a workplace for them on the Monitoring > Screens tab.
3.3.4. Storage Cluster Objects and Traps
Cluster-related objects that you can monitor:
- VSTORAGE-MIB:cluster
- General cluster information.
- VSTORAGE-MIB:csStatTable
- Chunk server statistics table.
- VSTORAGE-MIB:mdsStatTable
- Metadata server statistics table.
- VSTORAGE-MIB::clusterName
- Cluster name.
- VSTORAGE-MIB::healthStatus
- Cluster health status.
- VSTORAGE-MIB::usedLogicalSpace
- The space occupied by all data chunks and their replicas plus the space occupied by any other data stored on cluster nodes’ disks.
- VSTORAGE-MIB::totalLogicalSpace
- The total space on all cluster nodes’ disks.
- VSTORAGE-MIB::freeLogicalSpace
- The unused space on all cluster nodes’ disks.
- VSTORAGE-MIB::licenseStatus
- License status.
- VSTORAGE-MIB::licenseCapacity
- The maximum disk space available as defined by license.
- VSTORAGE-MIB::licenseExpirationStatus
- License expiration status.
- VSTORAGE-MIB::ioReadOpS
- Current read speed in operations per second.
- VSTORAGE-MIB::ioWriteOpS
- Current write speed in operations per second.
- VSTORAGE-MIB::ioReads
- Current read speed in bytes per second.
- VSTORAGE-MIB::ioWrites
- Current read write in bytes per second.
- VSTORAGE-MIB::csActive
- The number of active chunk servers.
- VSTORAGE-MIB::csTotal
- The total number of chunk servers.
- VSTORAGE-MIB::mdsAvail
- The number of running metadata servers.
- VSTORAGE-MIB::mdsTotal
- The total number of metadata servers.
- VSTORAGE-MIB::s3OsAvail
- The number of running S3 object servers.
- VSTORAGE-MIB::s3OsTotal
- The total number of S3 object servers.
- VSTORAGE-MIB::s3NsAvail
- The number of running S3 name servers.
- VSTORAGE-MIB::s3NsTotal
- The total number of S3 name servers.
- VSTORAGE-MIB::s3GwAvail
- The number of running S3 gateways.
- VSTORAGE-MIB::s3GwTotal
- The total number of S3 gateways.
CS-related objects that you can monitor:
- VSTORAGE-MIB::csId
- Chunk server identifier.
- VSTORAGE-MIB::csStatus
- Current chunk server status.
- VSTORAGE-MIB::csIoReadOpS
- Current read speed of a chunk server in operations per second.
- VSTORAGE-MIB::csIoWriteOpS
- Current write speed of a chunk server in operations per second.
- VSTORAGE-MIB::csIoWait
- The percentage of time spent waiting for I/O operations. Includes time spent waiting for synchronization.
- VSTORAGE-MIB::csIoReadS
- Current read speed of a chunk server in bytes per second.
- VSTORAGE-MIB::csIoWriteS
- Current write speed of a chunk server in bytes per second.
MDS-related objects you can monitor:
- VSTORAGE-MIB::mdsId
- Metadata server identifier.
- VSTORAGE-MIB::mdsStatus
- Current metadata server status.
- VSTORAGE-MIB::mdsMemUsage
- The amount of memory used by a metadata server.
- VSTORAGE-MIB::mdsCpuUsage
- The percentage of the CPU’s capacity used by a metadata server.
- VSTORAGE-MIB::mdsUpTime
- Time since the startup of a metadata server.
SNMP traps triggered by the specified alerts:
- license expired
- The license has expired.
- license_isnot_loaded
- The license is not loaded.
- too few free space
- The cluster is running out of logical space.
- too_few_free_phys_space
- The cluster is running out of physical space.
- offline node
- A cluster node is offline.
- too few nodes
- Too few cluster nodes are left.
- too few mdses
- Too few MDSes are left.
- too_much_mdses
- More than one MDS is on a node.
- too few cses
- Too few CSes are left.
- failed mds
- The MDS service has failed.
- failed cs
- The CS service has failed.
- cses_on_single_tier_have_different_journalling_settings
- A CS has incorrect journalling settings.
- cses_on_single_tier_have_different_encryption_settings
- A CS has incorrect encryption settings.
- smart_failed
- A disk has failed a S.M.A.R.T. check.
- disk_failed
- A disk has failed.
- too_few_root_space
- The root partition on a node is out of space.
- too_few_space_on_metadata_disk
- An MDS disk is out of space.
- low_level_network_settings
- A network interface is missing important features.
- half_duplex
- A network interface is not in the full duplex mode.
- low_speed
- A network interface has speed lower than 1 Gbps.
- undefined_speed
- A network interface has an undefined speed.
- network link
- A network interface is misconfigured.
- abgw_cert_expired
- Backup Gateway certificate has expired or will expire soon.
- iscsi_redundancy_disk
- The failure domain set for an iSCSI LUN does not make it highly available.
- s3_redundancy_disk
- The failure domain set for an S3 cluster does not make it highly available.
- software_updates
- Software updates exist for a node.
- no_internet_connection
- No internet connection on a node.
- disk_write_cache_disabled
- Disk write cache is disabled.
- disk_write_cache_status_unknown
- Disk write cache has an unknown status.
- compute_unavailable
- The compute cluster has failed.
- oom_happened
- OOM killer has been triggered.
- kernel_not_current
- The kernel is outdated on a node.
- no_ha
- High availability for the admin panel is not configured.
- time_not_synced
- Time is not synced on a node.
- iscsi_upgrade_failed
- iSCSI major upgrade has failed.
- backend_backup_is_too_old
- The last management node backup has failed, does not exist, or is too old.
- other
- Other alerts.
- spla_push_stats_failed
- Unable to push space usage statistics.
- spla_license_load_failed
- Unable to apply a SPLA license.
- spla_get_space_usage_failed
- Unable to get space usage.
To see the full list of generated alerts with their descriptions, refer to Viewing Alerts.