3.1. Monitoring the Entire Cluster
The overall storage cluster statistics are available on the MONITORING > Dashboard screen. Pay attention to the storage cluster status that can be one of the following:
- HEALTHY
- All cluster components are active and operate normally.
- UNAVAILABLE
- Not enough information about the cluster state (e.g., because the cluster is inaccessible).
- DEGRADED
- Some of the cluster components are inactive or inaccessible. The cluster is trying to heal itself, data replication is scheduled or in progress.
- ERROR
- The cluster has too many inactive services, automatic replication is disabled. If the cluster enters this state, troubleshoot the nodes or contact the support team.
To view the storage cluster statistics in full screen, click Fullscreen mode. To exit the fullscreen mode, press Esc or Exit fullscreen mode.
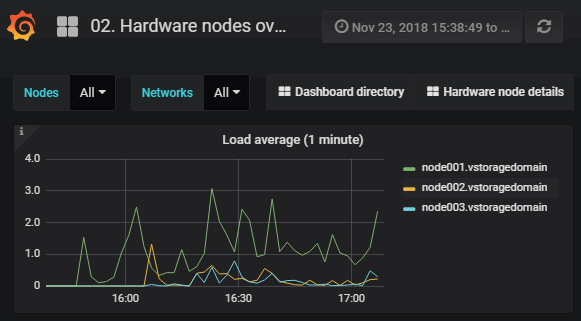
For advanced monitoring, click Grafana dashboard. A separate browser tab will open with preconfigured Grafana dashboards where you can manage existing dashboards, create new ones, share them between users, configure alerting, etc. The dashboards use the Prometheus data source. Its metrics are stored for 7 days. If you want to increase this retention period, you can configure it manually as described in Configuring Retention Policy for Prometheus Metrics. For more information, refer to Grafana documentation .
The default time interval for the charts is 12 hours. To zoom into a particular time interval, select the internal with the mouse; to reset zoom, double click any chart.
3.1.1. I/O Activity Charts
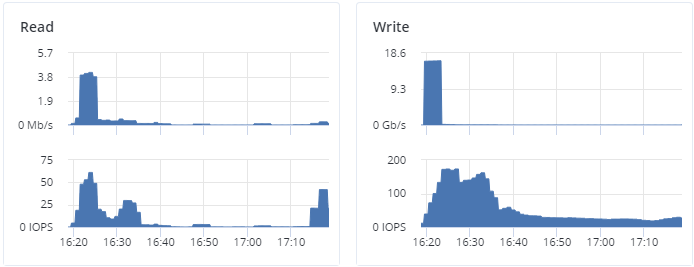
The Read and Write charts show the history of the cluster I/O activity as the speed of read and write I/O operations in megabytes per second and the number of read and write I/O operations per second (IOPS). For example:
3.1.2. Services Chart
On the Services chart, you can monitor two types of services:
- Metadata services (MDS). The number all disks with the metadata role. Ensure that at least three MDSes are running at all times.
- Chunk services (CS). The number of all disks with the storage role.
Typical statistics may look like this:
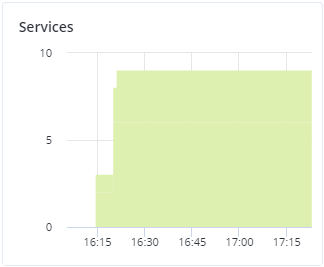
If some of the services were not in the healthy state for some time, these time periods will be highlighted in red on the chart.
3.1.3. Chunks Chart
You can monitor the state of all chunks in the cluster on the Chunks chart. Chunks can be in the following states:
- Healthy
- Number and percentage of chunks that have enough active replicas. The normal state of chunks.
- Offline
Number and percentage of chunks all replicas of which are offline. Such chunks are completely inaccessible for the cluster and cannot be replicated, read from or written to. All requests to an offline chunk are frozen until a CS that stores that chunk’s replica goes online.
Get offline chunk servers back online as fast as possible to avoid losing data.
- Blocked
Number and percentage of chunks which have fewer active replicas than the set minimum amount. Write requests to a blocked chunk are frozen until it has at least the set minimum amount of replicas. Read requests to blocked chunks are allowed, however, as they still have some active replicas left. Blocked chunks have a higher replication priority than degraded chunks.
Having blocked chunks in the cluster increases the risk of losing data, so postpone any maintenance on working cluster nodes and get offline chunk servers back online as fast as possible.
- Degraded
- Number and percentage of chunks whose active replicas are few but not below the set minimum. Such chunks can be read from and written to. However, in the latter case a degraded chunk becomes urgent.
Healthy chunks are highlighted on the scale in green, offline in red, blocked in yellow, and degraded in grey. For example:
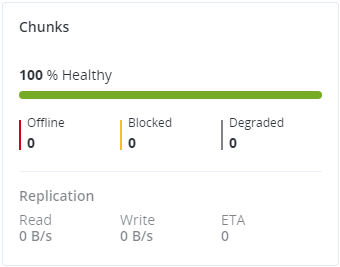
The Replication section shows the information about replication activity in the cluster.
3.1.4. Physical Space Chart
The Physical space chart shows the current usage of physical space in the entire storage cluster and on each particular tier. The used space includes the space occupied by all data chunks and their replicas plus the space occupied by any other data.
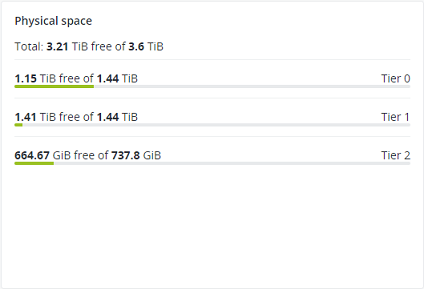
3.1.4.1. Understanding Physical Space
The total physical disk space is a total of all the disk space on all storage disks on the same tier. The used physical space is a total of all the user data on the storage disks of the same tier, considering the redundancy mode. The free disk space is the total physical space minus the used physical space.
To better understand how physical disk space is calculated, consider the following example:
| Used/Total (Free), GiB | |||
|---|---|---|---|
Tier 0, 3+2 encoding (67% overhead) |
Tier 1, 2 replicas (100% overhead) |
Tier 2, no redundancy | |
| Node 1 | 334/1024 (690) | 134/512 (378) | 50/256 (206) |
| Node 2 | 334/1024 (690) | 133/512 (379) | 50/256 (206) |
| Node 3 | 334/1024 (690) | 133/512 (379) | |
| Node 4 | 334/1024 (690) | ||
| Node 5 | 334/1024 (690) | ||
| Reported summary | 1670/5120 (3450) | 400/1536 (1136) | 100/512 (412) |
The cluster has ten disks with the storage role: five 1024 GiB disks are assigned to tier 0, three 512 GiB disks to tier 1, and two 256 GiB disk to tier 2. There is no other data on the disks (like system files, for example). Tier 0 stores 1000 GiB of user data in the 3+2 encoding mode. Tier 1 stores 200 GiB of user data in the 2 replicas mode. Tier 2 stores 100 GB of user data with no redundancy.
No matter what redundancy mode is used, the cluster attempts to spread data chunks evenly across disks of the same tier.
In this example, the physical disk space on each tier is reported as follows:
- On tier 0, the total disk space is 5120 GiB, the used disk space is 1670 GiB, and the free disk space is 3450 GiB;
- On tier 1, the total disk space is 1536 GiB, the used disk space is 400 GiB, and the free disk space is 1136 GiB;
- On tier 2, the total disk space is 512 GiB, the used disk space is 100 GiB, and the free disk space is 456 GiB.
3.1.5. Logical Space Chart
The Logical space chart represents all the space allocated to different services for storing user data. This includes the space occupied exclusively by user data. Replicas and erasure coding metadata are not taken into account.
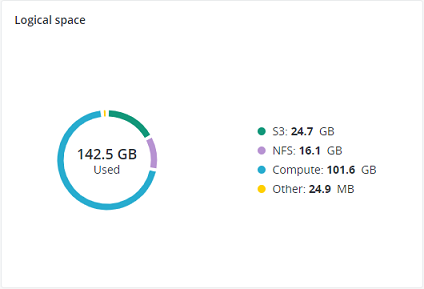
3.1.5.1. Understanding Logical Space
When monitoring disk space information in the cluster, keep in mind that logical space is the amount of free disk space that can be used for storing user data in the form of data chunks and all their replicas. Once this space runs out, no data can be written to the cluster.
To better understand how logical disk space is calculated, consider the following example:
- The cluster has three disks with the storage role. The first disk has 200 GB of space, the second one has 500 GB, and the third one has 1 TB.
- If the redundancy mode is set to three replicas, each data chunk must be stored as three replicas on three different disks with the storage role.
In this example, the available logical disk space will be 200 GB, that is, equal to the capacity of the smallest disk with the storage role. The reason is that each replica must be stored on a different disk. So once the space on the smallest disk (i.e. 200 GB) runs out, no new chunk replicas can be created unless a new disk with the storage role is added or the redundancy mode is changed to two replicas.
With the two replicas redundancy mode, the available logical disk space would be 700 GB, because the two smallest disks combined can hold 700 GB of data.