6.3. Monitoring Chunk Servers
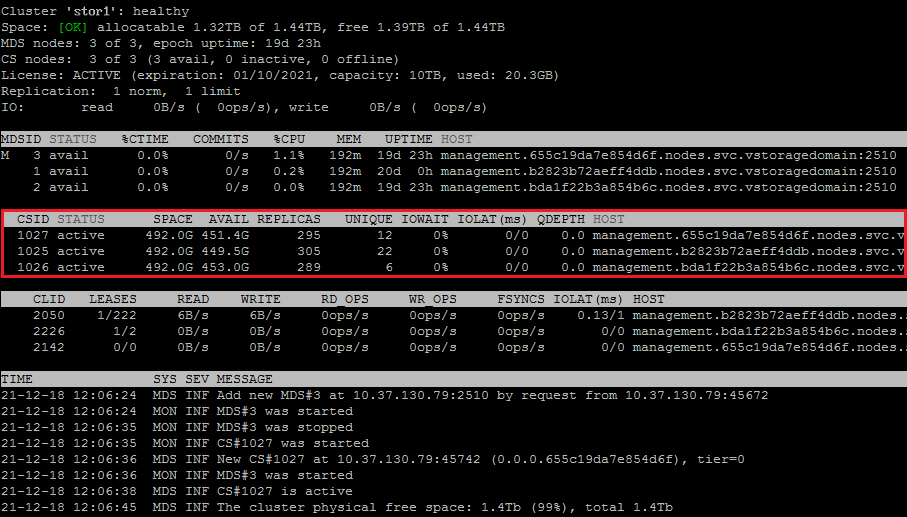
By monitoring chunk servers, you can keep track of the disk space available in the storage cluster. To monitor chunk servers, use the vstorage -c <cluster_name> top command. For example:

The command above shows detailed information about the stor1 cluster. The monitoring parameters for chunk servers (highlighted in red) are as follows:
- CSID
- Chunk server identifier (ID).
- STATUS
Chunk server status:
- active
- The chunk server is up and running.
- failed
- The chunk server process is running but a problem has occured with the CS disk.
- inactive
- The chunk server is temporarily unavailable. A chunk server is marked as inactive during its first 5 minutes of inactivity.
- offline
- The chunk server is inactive for more than 5 minutes. After the chunk server goes offline, the cluster starts replicating data to restore the chunks that were stored on the affected chunk server.
- dropped
- The chunk server was removed by the administrator.
- maintenance
- The node that the chunk server is located on is in maintenance.
- SPACE
- Total amount of disk space on the chunk server.
- AVAIL
- Available disk space on the chunk server.
- REPLICAS
- Number of replicas stored on the chunk server.
- UNIQUE
- Number of chunks that do not have replicas.
- IOWAIT
- Percentage of time spent waiting for I/O operations being served.
- IOLAT
- Average/maximum time, in milliseconds, the client needed to complete a single IO operation during the last 20 seconds.
- QDEPTH
- Average chunk server I/O queue depth.
- HOST
- Chunk server hostname or IP address.
- FLAGS
The following flags may be shown for active chunk servers:
- J
- The CS uses a write journal.
- C
- Checksumming is enabled for the CS. Checksumming lets you know when a third party changes the data on the disk.
- D
- Direct I/O, the normal state for a CS without a write journal.
- c
- The chunk server’s write journal is clean, there is nothing to commit from the write journaling SSD to the HDD where the CS is located.
6.3.1. Understanding Disk Space Usage
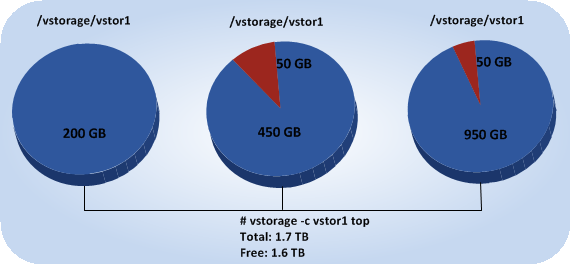
Usually, you get the information on how disk space is used in your cluster with the vstorage top command. This command displays the following disk-related information: total space, free space, and allocatable space. For example:
# vstorage -c stor1 top
connected to MDS#1
Cluster 'stor1': healthy
Space: [OK] allocatable 180GB of 200GB, free 1.6TB of 1.7TB
...
In this command output:
1.7TB is the total disk space in the
stor1cluster. The total disk space is calculated on the basis of used and free disk space on all partitions in the cluster. Used disk space includes the space occupied by all data chunks and their replicas plus the space occupied by any other files stored on the cluster partitions.Let us assume that you have a 100 GB partition and 20 GB on this partition are occupied by some files. Now if you set up a chunk server on this partition, this will add 100 GB to the total disk space of the cluster, though only 80 GB of this disk space will be free and available for storing data chunks.
1.6TB is the free disk space in the
stor1cluster. Free disk space is calculated by subtracting the disk space occupied by data chunks and any other files on the cluster partitions from the total disk space.For example, if the amount of free disk space is 1.6 TB and the total disk space is 1.7 TB, this means that about 100 GB on the cluster partitions are already occupied by some files.

allocatable 180GB of 200GBis the amount of free disk space that can used for storing data chunks. See Understanding allocatable disk space below for details.
6.3.1.1. Understanding Allocatable Disk Space
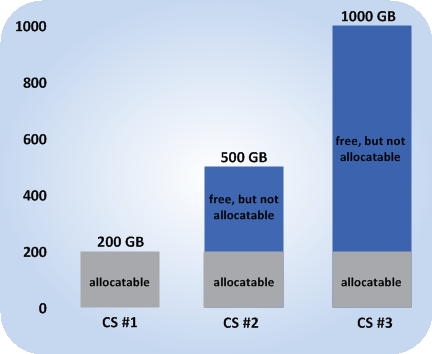
When monitoring disk space information in the cluster, you also need to pay attention to the space reported by the vstorage top utility as allocatable. Allocatable space is the amount of disk space that is free and can be used for storing user data. Once this space runs out, no data can be written to the cluster.
Calculation of allocatable disk space is illustrated on the following example:
- The cluster has 3 chunk servers. The first chunk server has 200 GB of disk space, the second one — 500 GB, and the third one — 1 TB.
- The default replication factor of 3 is used in the cluster, meaning that each data chunk must have 3 replicas stored on three different chunk servers.

In this example, the available disk space is 200 GB, which equals the amount of disk space on the smallest chunk server:
# vstorage -c stor1 top
connected to MDS#1
Cluster 'stor1': healthy
Space: [OK] allocatable 180GB of 200GB, free 1.6TB of 1.7TB
...
In this cluster configuration each server is set to store one replica for each data chunk. So once the disk space on the smallest chunk server (200 GB) runs out, no more chunks in the cluster can be created until a new chunk server is added or the replication factor is decreased.
If the replication factor changes to 2, the vstorage top command will report the available disk space as 700 GB:
# vstorage set-attr -R /mnt/vstorage replicas=2:1
# vstorage -c stor1 top
connected to MDS#1
Cluster 'stor1': healthy
Space: [OK] allocatable 680GB of 700GB, free 1.6TB of 1.7TB
...
The available disk space has increased because now only 2 replicas are created for each data chunk and new chunks can be made even if the smallest chunk server runs out of space (in this case, replicas will be stored on a bigger chunk server).
Allocatable disk space may also be limited by license.
6.3.1.2. Viewing Space Occupied by Data Chunks
To view the total amount of disk space occupied by all user data in the cluster, run the vstorage top command and press the V key on your keyboard. Once you do this, your command output should look like the following:
# vstorage -c stor1 top
Cluster 'stor1': healthy
Space: [OK] allocatable 1.32TB of 1.44TB, free 1.39TB of 1.44TB
MDS nodes: 3 of 3, epoch uptime: 19d 23h, cluster version: 128
CS nodes:  3 of 3 (3 avail, 0 inactive, 0 offline), storage version: 128
License: ACTIVE (expiration: 01/10/2021, capacity: 10TB, used: 20.3GB)
Replication:  1 norm,  1 limit
Chunks: [OK] 323 (100%) healthy,  0 (0%) standby,  0 (0%) degraded,  0 (0%) urgent,
             0 (0%) blocked,  0 (0%) pending,  0 (0%) offline,  0 (0%) replicating,
             0 (0%) overcommitted,  0 (0%) deleting,  0 (0%) void
FS:  20.3GB in 757 files, 757 inodes,  244 file maps,  323 chunks,  889 chunk replicas
IO:       read     0B/s (  0ops/s), write     0B/s (  0ops/s)
IO total: read   37.1GB ( 473Kops), write  133.7GB ( 4.7Mops)
Repl IO:  read     0B/s, write:     0B/s
Sync rate:   0ops/s, datasync rate:   0ops/s
IO QDEPTH: 0.0 aver, 0.0 max
...
The FS field shows the size of all user data in the cluster without consideration for replicas.
6.3.2. Exploring Chunk States
The following is a list of all possible chunk states.
- Healthy
- Number and percentage of chunks that have enough active replicas. The normal state of chunks.
- Offline
Number and percentage of chunks all replicas of which are offline. Such chunks are completely inaccessible for the cluster and cannot be replicated, read from or written to. All requests to an offline chunk are frozen until a CS that stores that chunk’s replica goes online.
Get offline chunk servers back online as fast as possible to avoid losing data.
- Blocked
Number and percentage of chunks which have fewer active replicas than the set minimum amount. Write requests to a blocked chunk are frozen until it has at least the set minimum amount of replicas. Read requests to blocked chunks are allowed, however, as they still have some active replicas left. Blocked chunks have a higher replication priority than degraded chunks.
Having blocked chunks in the cluster increases the risk of losing data, so postpone any maintenance on working cluster nodes and get offline chunk servers back online as fast as possible.
- Degraded
- Number and percentage of chunks whose active replicas are few but not below the set minimum. Such chunks can be read from and written to. However, in the latter case a degraded chunk becomes urgent.
- Replicating
- Number and percentage of chunks which are being replicated. Write operations on such chunks are frozen until replication ends.
- Void
- Number and percentage of chunks that have been allocated but never used yet. Such chunks contain no data. It is normal to have some void chunks in the cluster.
- Pending
- Number and percentage of chunks that must be replicated immediately. For a write request from client to a chunk to complete, the chunk must have at least the set minimum amount of replicas. If it does not, the chunk is blocked and the write request cannot be completed. As blocked chunks must be replicated as soon as possible, the cluster places them in a special high-priority replication queue and reports them as pending.
- Urgent
- Number and percentage of chunks which are degraded and have non-identical replicas. Replicas of a degraded chunk may become non-identical if some of them are not accessible during a write operation. As a result, some replicas happen to have the new data while some still have the old data. The latter are dropped by the cluster as fast as possible. Urgent chunks do not affect information integrity as the actual data is stored in at least the set minimum amount of replicas.
- Overcommitted
- Number and percentage of chunks that have more replicas than normal. Usually these chunks appear after the normal number of replicas has been lowered or a lot of data has been deleted. Extra replicas are eventually dropped, however, this process may slow down during replication.
- Deleting
- Number and percentage of chunks queued for deletion.
