Monitoring the storage cluster
To view the storage cluster status
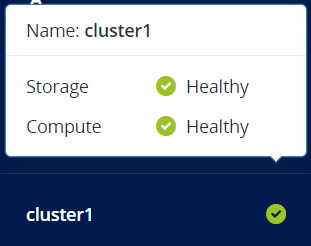
Click the cluster name at the bottom of the left menu. The status can be one of the following:
- Healthy
- All cluster components are active and operate normally.
- Unavailable
- Not enough information about the cluster state (for example, because the cluster is inaccessible).
- Degraded
- Some of the cluster components are inactive or inaccessible. The cluster is trying to heal itself, data replication is scheduled or in progress.
- Error
- The cluster has too many inactive services and automatic replication is disabled. If the cluster enters this state, troubleshoot the nodes or contact the support team.
To view the storage cluster statistics
Go to the Monitoring > Dashboard screen:
- To view the storage cluster statistics in full screen, click Fullscreen mode.
- To exit the fullscreen mode, press Esc or click Exit fullscreen mode.
The default time interval for the charts is twelve hours. To zoom into a particular time interval, select the internal with the mouse; to reset zoom, double-click any chart.
To view more details about the storage cluster
Go to the Monitoring > Dashboard screen, and then click Grafana dashboard.
A separate browser tab will open with preconfigured Grafana dashboards where you can manage existing dashboards, create new ones, share them between users, configure alerting, etc. The dashboards use the Prometheus data source. Its metrics are stored for seven days. If you want to increase this retention period, you can configure it manually, as described in "Configuring retention policy for prometheus metrics" in the Administrator Command Line Guide. For more information, refer to Grafana documentation.