Monitoring the compute cluster
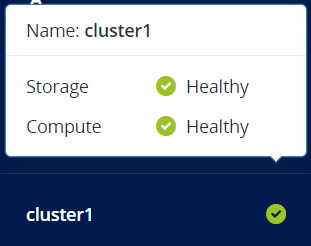
After you create the compute cluster, you can monitor its status and statistics. The status is displayed by clicking the cluster name at the bottom of the left menu. It can be one of the following:
- Healthy
- All compute cluster components and nodes operate normally.
- Configuring
- The compute cluster configuration (the default CPU model for VMs or the number of compute nodes) is changing.
- Warning
- The compute cluster operates normally but some issues have been detected.
- Critical
- The compute cluster has encountered a critical problem and is not operational.
The compute cluster statistics are available on the Compute > Overview screen. The charts show the information on CPU, RAM, and storage usage; the number of virtual machines grouped by status and resource consumption; and compute-related alerts.
Additionally, you can monitor separate compute nodes, virtual machines, and load balancers.